Annual Report to shareholders & Appendix 4E
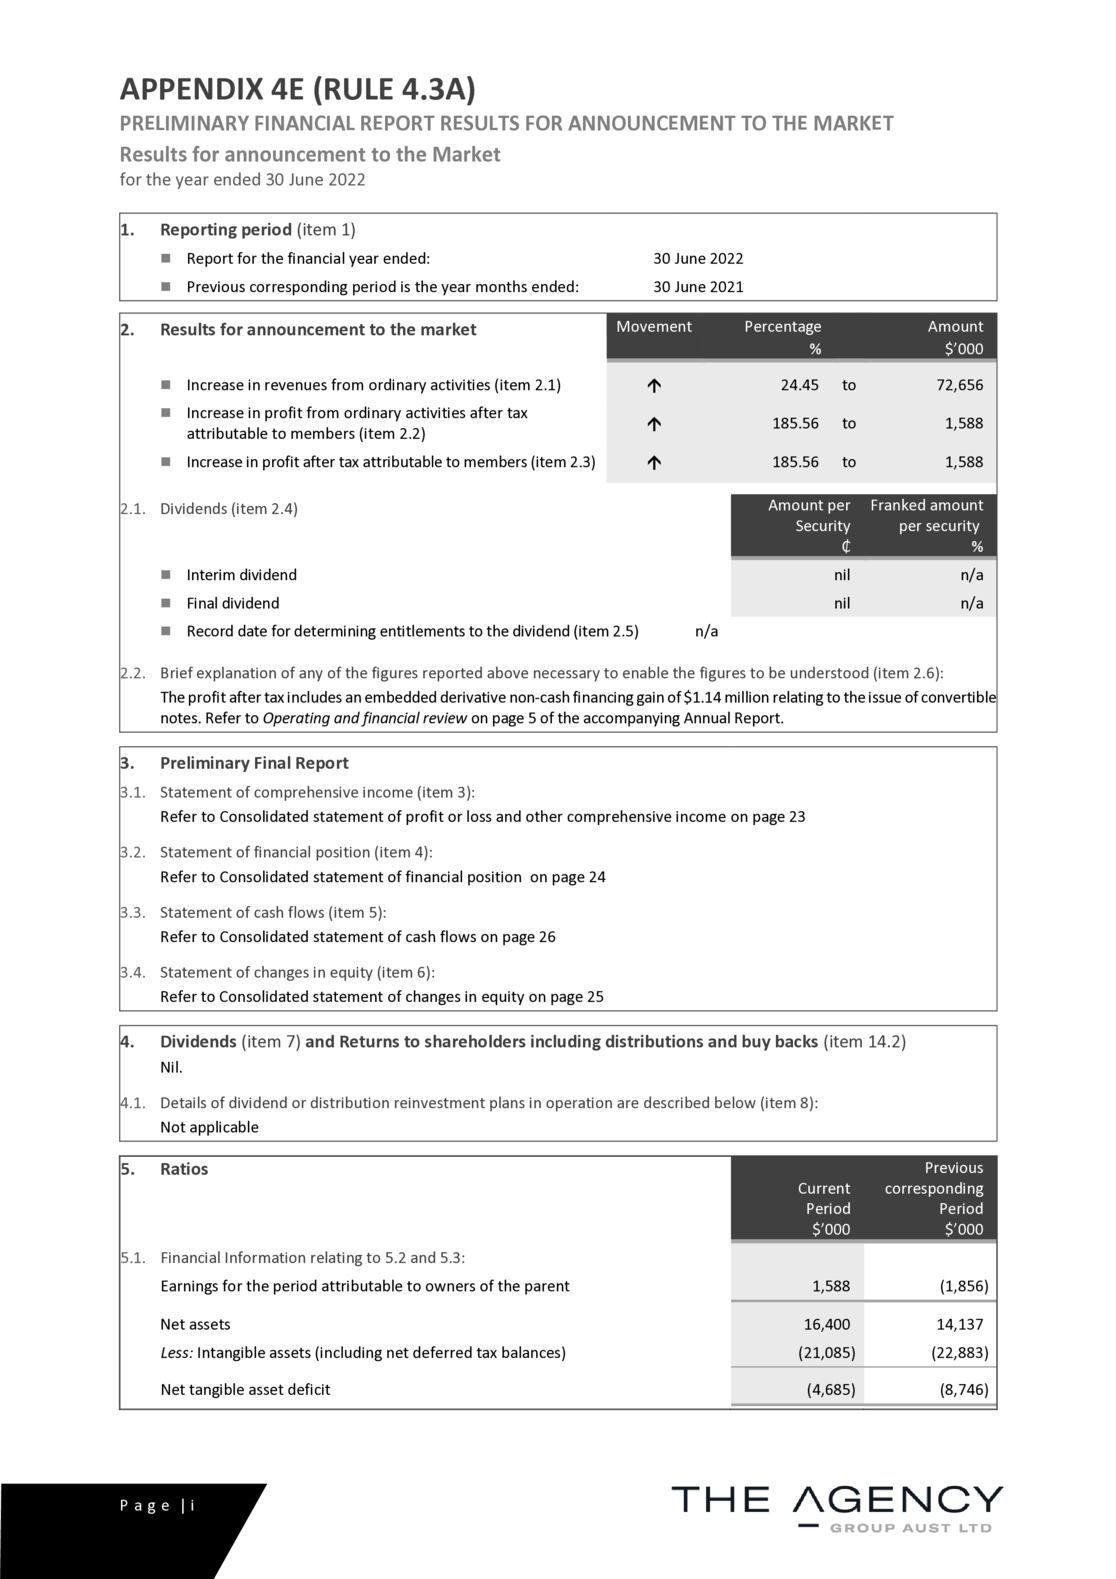
APPENDIX 4E (RULE 4.3A) PRELIMINARY FINANCIAL REPORT RESULTS FOR ANNOUNCEMENT TO THE MARKET Results for announcement to the Market for the year ended 30 June 2022
1. Reporting period (item 1) ◼ Report for the financial year ended: 30 June 2022 ◼ Previous corresponding period is the year months ended: 30 June 2021
2. Results for announcement to the market Movement Percentage Amount % $’000
◼ Increase in revenues from ordinary activities (item 2.1) 24.45 to 72,656 ◼ Increase in profit from ordinary activities after tax 185.56 to 1,588 attributable to members (item 2.2) ◼ Increase in profit after tax attributable to members (item 2.3) 185.56 to 1,588
2.1. Dividends (item 2.4) Amount per Franked amount Security per security ₵ % ◼ Interim dividend nil n/a ◼ Final dividend nil n/a ◼ Record date for determining entitlements to the dividend (item 2.5) n/a
2.2. Brief explanation of any of the figures reported above necessary to enable the figures to be understood (item 2.6): The profit after tax includes an embedded derivative non-cash financing gain of $1.14 million relating to the issue of convertible notes. Refer to Operating and financial review on page 5 of the accompanying Annual Report.
3. Preliminary Final Report 3.1. Statement of comprehensive income (item 3): Refer to Consolidated statement of profit or loss and other comprehensive income on page 23
3.2. Statement of financial position (item 4): Refer to Consolidated statement of financial position on page 24
3.3. Statement of cash flows (item 5): Refer to Consolidated statement of cash flows on page 26
3.4. Statement of changes in equity (item 6): Refer to Consolidated statement of changes in equity on page 25
4. Dividends (item 7) and Returns to shareholders including distributions and buy backs (item 14.2) Nil.
4.1. Details of dividend or distribution reinvestment plans in operation are described below (item 8): Not applicable
5. Ratios Previous Current corresponding Period Period $’000 $’000 5.1. Financial Information relating to 5.2 and 5.3: Earnings for the period attributable to owners of the parent 1,588 (1,856)
Net assets 16,400 14,137 Less: Intangible assets (including net deferred tax balances) (21,085) (22,883)
Net tangible asset deficit (4,685) (8,746)
P a g e |i
APPENDIX 4E (RULE 4.3A) PRELIMINARY FINANCIAL REPORT RESULTS FOR ANNOUNCEMENT TO THE MARKET Results for announcement to the Market for the year ended 30 June 2022
5 Ratios (cont.) Previous Current corresponding Period Period No. No.
Fully paid ordinary shares 428,575,921 428,575,916
Weighted average number of ordinary shares outstanding during the period used in 428,575,917 353,288,916 calculation of basic earnings per share (EPS) ₵ ₵
5.2. Net tangible assets backing per share (item 9): (1.09) (2.04)
5.3. Earnings per share attributable to owners of the parent (item 14.1): 0.37 (0.53)
As at 30 June 2022, the Group has 30,000,000 unissued shares under options (2021: 333,333) and 11,000,000 performance shares on issue (30 June 2021: 1,555,558). As at 30 June 2022, of the 30,000,000 options granted and issued, 10,000,000 options have vested and are exercisable. No performance rights have vested. Unvested options and performance rights are not considered to be dilutive. In addition, the Group does not report diluted earnings per share on losses generated by the Group. During the 2021 year, the Group’s unissued shares under option and performance shares were anti-dilutive. As at 30 June 2022 diluted EPS (cents per share) was 0.37 cents (2021: N/A).
6. Details of entities over which control has been gained or lost during the period (item 10): 6.1. Control gained over entities ◼ Name of entities (item 10.1) Nil ◼ Date(s) of gain of control (item 10.2)
6.2. Loss of control of entities ◼ Name of entities (item 10.1) Nil ◼ Date(s) of loss of control (item 10.2)
6.3. Contribution to consolidated profit (loss) from ordinary activities after tax by the controlled entities to the date(s) in the current period when control was gained / lost (item 10.3). 6.4. Profit (loss) from ordinary activities after tax of the controlled entities for the whole of the previous corresponding period (item 10.3)
7. Details of associates and joint venture (item 11): ◼ Name of entities (item 11.1) Nil ◼ Percentage holding in each of these entities (item 11.2) n/a Previous corresponding Current period Period $ $ ◼ Aggregate share of profits (losses) of these entities (item 11.3) N/A N/A
8. Any other significant information needed by an investor to make an informed assessment of the entity’s financial performance and financial position (item 12): Refer to Operating and financial review on page 5 of the accompanying Annual Report.
9. The financial information provided in the Appendix 4E is based on the annual report (attached), which has been prepared in accordance with Australian Accounting Standards (item 13)
10. A commentary on the results for the period (item 14): Refer to Operating and financial review on page 5 of the accompanying Annual Report.
11. The preliminary final report has been prepared based on the 30 June 2022 accounts which have been audited by an independent audit firm in accordance with the requirements of section 302 of the Corporations Act 2001 (Cth). (item 15)
P a g e | ii
ABN 52 118 913 232
and its controlled entities
ANNUAL REPORT 30 June 2022
THE AGENCY GROUP AUSTRALIA LTD ANNUAL REPORT AND CONTROLLED ENTITIES 30 June 2022 ABN 52 118 913 232
Corporate directory
Current Directors Andrew Jensen Executive Chairman and Chief Operating Officer Geoff Lucas Managing Director and CEO Paul Niardone Executive Director Adam Davey Non-executive Director
Company Secretary Stuart Usher
Registered Office and Head Office Share Registry Street: 68 Milligan Street Advanced Share Registry Limited PERTH WA 6000 Street + Postal: 110 Stirling Highway Postal: PO Box 7768 NEDLANDS WA 6009 CLOISTERS SQUARE WA 6850 Telephone: 1300 113 258 (within Australia) Telephone: +61 (0)8 9204 7955 +61 (0)8 9389 8033 (International) Facsimile: +61 (0)8 9204 7956 Facsimile: +61 (0)8 6370 4203 Email: info@theagencygroup.com.au Email: admin@advancedshare.com.au Website: theagencygroup.com.au Website: www.advancedshare.com.au
Auditors Securities Exchange Hall Chadwick WA Audit Pty Ltd Australian Securities Exchange 283 Rokeby Road Level 40, Central Park, 152-158 St Georges Terrace SUBIACO WA 6008 Perth WA 6000 Telephone: +61 (0)8 9426 0666 Telephone: 131 ASX (131 279) (within Australia) Telephone: +61 (0)2 9338 0000 Solicitors Facsimile: +61 (0)2 9227 0885 Steinepreis Paganin Website: www.asx.com.au Level 4, The Read Buildings ASX Code AU1 16 Milligan Street Perth WA 6000
P a g e |i
ANNUAL REPORT THE AGENCY GROUP AUSTRALIA LTD 30 June 2022 AND CONTROLLED ENTITIES ABN 52 118 913 232
Contents
◼ Chairman’s and Managing Director’s letter ……………………………………………………………………………………………………………….. 1 ◼ Directors’ report …………………………………………………………………………………………………………………………………………………….. 3 ◼ Remuneration report ……………………………………………………………………………………………………………………………………………. 12 ◼ Auditor’s independence declaration ……………………………………………………………………………………………………………………….. 22 ◼ Consolidated statement of profit or loss and other comprehensive income…………………………………………………………………. 23 ◼ Consolidated statement of financial position ………………………………………………………………………………………………………….. 24 ◼ Consolidated statement of changes in equity …………………………………………………………………………………………………………… 25 ◼ Consolidated statement of cash flows …………………………………………………………………………………………………………………….. 26 ◼ Notes to the consolidated financial statements ……………………………………………………………………………………………………….. 27 ◼ Directors’ declaration ……………………………………………………………………………………………………………………………………………. 74 ◼ Independent auditor’s report…………………………………………………………………………………………………………………………………. 75 ◼ Corporate governance statement …………………………………………………………………………………………………………………………… 80 ◼ Additional Information for Listed Public Companies ………………………………………………………………………………………………….. 81
P a g e | ii
THE AGENCY GROUP AUSTRALIA LTD ANNUAL REPORT AND CONTROLLED ENTITIES 30 June 2022 ABN 52 118 913 232
Chairman’s and Managing Director’s letter
Dear Shareholders,
We’re pleased to announce The Agency again set new records in the 2022 financial year. We exchanged 5,709 properties worth a combined $5.9 billion, representing the fourth straight year of growth in all key metrics. The number of properties sold increased by 15% compared to FY2021, significantly outperforming the Australian market growth of 3.2%1. FY2022 saw our Gross Commission Income grow 27% to $102.5 million, well above market growth.
Our businesses in Western Australia, Queensland, Victoria, ACT, NSW and now Tasmania are firmly established and poised for further expansion. From our assessment, we have calculated that we sold property in around 34% of the addressable market in the last 12 months. This shows the potential reach of our current infrastructure, but more importantly, also highlights that we have many further markets to tap into as we grow our national market share. Our priority is to build depth in these existing markets, as well as grow into additional markets.
The strength and appeal of our brand continues to grow. With 85 net agents joining the brand in FY2022, we now have 393 agents nationally, as at 30 June 2022. Agents are attracted to our direct engagement model which has created a more responsive, efficient and effective model, removing the typical franchise ‘middle layer’. Our direct engagement model alleviates our agents from the distractions of managing office overheads and the administrative burden associated with operating a franchise and instead, allows agents to focus on the high dollar value activities like servicing their customers.
We will continue our commitment to expand our market presence and increase our national market share.
We’ve had a busy and productive year, strengthening our national presence by opening new offices in Canberra ACT, Toowoomba, Gold Coast and the Sunshine Coast in QLD, and Manly, NSW.
Post 30 June 2022, The Agency announced and settled the acquisition of the Bushby Property Group located in Launceston, Tasmania which represents our entry into our sixth state and territory. This exciting acquisition brings to our business nine sales agents within the 32 staff who have sold over $125 million in residential property over the past 12 months and circa 1,300 properties under management. We are looking forward to servicing Tasmania’s communities and securing our share of the market.
As part of the completion of this acquisition, we have extended our primary banking facility with Macquarie Bank until July 2025, and we have extended the Convertible Note issued by Peters Investments until Jan 2026 (subject to shareholder approval). Both extensions are key milestones that will assist laying the foundation of our continued growth in FY2023 and beyond.
Looking ahead to FY2023, there are a number of strategic objectives that the management team are delivering to further our reach across the Australian real estate market. The continued growth in agent numbers, utilisation of appropriate technology for a superior agent experience and continued assessment of M&A opportunities to drive economies of scale, are key priorities that will propel our business forward.
1 CoreLogic July 2022 Monthly Housing Chart Pack
P a g e |1
ANNUAL REPORT THE AGENCY GROUP AUSTRALIA LTD 30 June 2022 AND CONTROLLED ENTITIES ABN 52 118 913 232
We’re proud of our achievements but there’s still enormous opportunity for further scale and growth. Whilst pleased with our continued growth and delivery of exceptional results and service to our customers, our total commissions of $102.5 million is just a fraction of the $7.6 billion2 total Australian residential real estate commissions. We believe our contemporary business model, national reach, culture, and commitment to excellence in customer service means we are well positioned to expand our share of this $7.6 billion residential sales commissions market.
On behalf of the Board and the management team, we would like to thank shareholders for their support and loyalty during the financial year, and look forward to your continued support throughout FY2023.
Finally, we would like to thank our team members and partners for their unwavering support and commitment to our company and its future prosperity.
ANDREW JENSEN GEOFF LUCAS Chairman Managing Director and CEO
2 Assessed at 1.50% Average Commission Rate on FY22 Gross Sales Volume of $521.2Bn (CoreLogic July 2022 Monthly Housing Chart Pack)
P a g e |2
THE AGENCY GROUP AUSTRALIA LTD ANNUAL REPORT AND CONTROLLED ENTITIES 30 June 2022 ABN 52 118 913 232
Directors’ report Your directors present their report on the Group, consisting of The Agency Group Australia Ltd (The Agency or the Company) and its controlled entities (collectively the Group), for the financial year ended 30 June 2022. The Agency is listed on the Australian Securities Exchange (ASX:AU1).
1. Directors The names of Directors in office at any time during or since the end of the year are: ◼ Andrew Jensen Executive Chairman and Chief Operating Officer ◼ Geoff Lucas Managing Director and CEO Appointed 28 January 2022 ◼ Paul Niardone Executive Director ◼ Adam Davey Non-Executive Director ◼ Matthew Lahood Executive Director and CEO – Real Estate Mr Lahood stepped down as Executive Director on 28 January 2022; however, he remains a key management person in the position as CEO – Real Estate. (collectively the Directors or the Board) Directors have been in office since the start of the financial year to the date of this report unless otherwise stated. For additional information of Directors including details of the qualifications of Directors, please refer to paragraph 6 of this Directors Report.
2. Company secretary The following person held the position of Company Secretary at the end of the financial year:
◼ Stuart Usher Qualifications B.Bus, CPA, Grad Dip CSP, MBA, AGIA, ACIS
Experience Mr Usher is a CPA and Chartered Company Secretary with 25 years of extensive experience in the management and corporate affairs of public listed companies. He holds an MBA from the University of Western Australia and has extensive experience across many industries focusing on Corporate & Financial Management, Strategy & Planning, Mergers & Acquisitions, and Investor Relations & Corporate Governance.
3. Dividends paid or recommended There were no dividends paid or recommended during the financial year ended 30 June 2022.
4. Significant Changes in the state of affairs There have been no significant changes in the state of affairs of the Group during the financial year ended 30 June 2022 other than disclosed elsewhere in this Annual Report.
5. Operating and financial review 5.1. Nature of Operations Principal Activities The principal activity of the Group for the financial year was real estate services and related activities. There were no significant changes in the nature of the Group’s principal activities during the financial year.
5.2. Operations Review a. Key Metrics
ANNUAL GROUP REVENUE ($M) GROSS COMMISSION INCOME (GCI) ($M)
102.5 58.4 72.7 80.7 41.9 47.9 28.3 37.9 16.8 28.8
FY18 FY19 FY20 FY21 FY22 FY18 FY19 FY20 FY21 FY22
P a g e |3
ANNUAL REPORT THE AGENCY GROUP AUSTRALIA LTD 30 June 2022 AND CONTROLLED ENTITIES ABN 52 118 913 232
Directors’ report
NUMBER OF EXCHANGES VALUE OF EXCHANGES ($B)
5,709 5.9 4,964 4.8 3,147 2.9 2,409 2.4 1,540 1.8
FY18 FY19 FY20 FY21 FY22 FY18 FY19 FY20 FY21 FY22
Throughout FY2022, The Agency continued to grow its operating results for all key metrics. The results continue the year- on-year growth that has been achieved for the for the past four years. This includes expanding into the ACT market and as at 30 June 2022, The Agency had a presence in five states and territories across Australia.
Group Revenue for FY2022 of $72.7 million is up 24% on FY2021’s Group revenue of $58.4 million. This increase is primarily due an increase of 27% in Gross Commission Income (GCI)1 to $102.5 million (FY2021: $80.7 million).
The Group recorded 5,709 properties sold during FY2022, a 15% increase from FY2021 (4,964 properties sold in FY2021). The value of these sales amounted to $5.9 billion in property value sold during FY2022 (FY2021: $4.8 billion).
As at 30 June 2022, The Agency Group consisted of 393 agents, a net increase of 85 agents throughout FY2022 (30 June 2021: 308 Agents). Following the settlement of the Bushby acquisition in July 2022 and entry into its sixth state and territory, The Agency group has surpassed 400 agents.
The Agency reported a total management portfolio of 3,469 Properties Under Management as at 30 June 2022. Management have valued this property management portfolio at $19.0 million based on a blended valuation multiple of 3.66x on Q4 FY2022 annualised property management fee revenue. Under accounting standards, the value of internally generated Properties Under Management is not held on the balance sheet as an intangible asset. As a result of this, only $10.1 million of the $19.0 million is held on balance sheet.
The Company also witnessed growth in its Mortgage Solutions Australia (MSA) business with the number of home loan approvals for FY2022 up 13% year-on-year from 412 to 464 and its Landmark Settlements business with the number of deals up from 1,538 in FY21 to 1,803 in FY2022, an increase of 17%.
The Group reported net cash receipts of $78.86 million for the FY2022, a 10% year-on-year increase (FY2021: $71.57 million).
5.3. Financial Review The financial statements have been prepared on a going concern basis, which contemplates the continuity of normal business activity and the realisation of assets and the settlement of liabilities in the ordinary course of business.
The Agency continued its growth during FY2022 delivering four quarters of positive EBITDA as well as positive net operating cash flow. In line with ASX Listing Rules Guidance Note 23 Quarterly Reports, following four consecutive quarters of positive net operating cash flows over the 1 April 2021 to 31 March 2022 periods for the Group, The Agency has received ASX approval that the Appendix 4C Quarterly report for entities subject to Listing Rule 4.7B lodgements are no longer required.
For FY2022 the Group recorded EBITDA of $5.69 million (FY2021: $6.37 million). After adjusting for the AAB16 Leases impact and government incentives received, underlying EBITDA for FY2022 was $3.85 million. This represents a $0.79 million increase in underlying EBITDA, which equates to a 26% increase from the comparative period. a. Non-IFRS information The Company reports EBITDA in addition to the Profit after Tax. EBITDA is a financial measure which is not prescribed by Australian Accounting Standards (AAS) and represents the statutory profit under AAS adjusted for specific non-cash and significant items. The Company’s directors consider EBITDA to reflect the core earnings of the consolidated entity. A reconciliation between EBITDA and profit after income tax for the year ended 30 June 2022 is noted below.
1 Gross Commissions Income (GCI) represents fees a vendor pays for the sale of a property
P a g e |4
THE AGENCY GROUP AUSTRALIA LTD ANNUAL REPORT AND CONTROLLED ENTITIES 30 June 2022 ABN 52 118 913 232
Directors’ report EBITDA calculation FY2022 FY2021 Change Change $’000 $’000 $’000 %
Profit / (loss) after tax 1,588 (1,856) +3,444 +186%
Income tax benefit (1,127) (1,894) Profit / (loss) before tax 461 (3,750) +4,211 +112%
Interest income (37) (19) Depreciation and amortisation 5,440 5,466 Embedded derivative non-cash financing (gains) / costs2 (1,140) 2,244 Impairment (recovery) / expense (400) 400 Interest and finance costs 816 2,011 Gain financial assets at FVPL (123) – Profit on Sale of Assets3 (5) (201) Share-based payments expense 675 216
EBITDA 5,687 6,367 – 680 -11%
AASB 16 Leases impact4 (1,835) (1,794)
EBITDA (pre-AASB16 Leases impact) 3,852 4,573 – 721 -16%
Government incentives – (1,511)
Underlying EBITDA 3,852 3,062 + 790 +26%
Other key metrics:
◼ Revenue 72,656 58,380 +14,276 +24%
◼ GCI 102,486 80,660 +21,826 +27%
The Group generated a net profit after tax for the year of $1.59 million (FY2021: $1.86 million loss). This was primarily impacted by the embedded derivative non-cash financing gains ($1.14 million), impairment recovery ($0.40 million), interest and finance costs ($(0.82) million), and depreciation and amortisation ($(5.44) million).
The net assets of the Group have increased from 30 June 2021 by $2.26 million to $16.40 million at 30 June 2022 (30 June 2021: $14.14 million).
The Group’s cash and cash equivalents increased from 30 June 2021 by $3.12 million to $8.22 million at 30 June 2022 (2021: $5.10 million).
Government incentives and related grants were received during the prior year and used to support employee sales agents in Perth. These were included in 2021 operational cash flows.
5.4. Key Business Risks The Group is subject to various risk factors. Some of these are specific to its business activities while others are of a more general nature. Individually, or in combination, these risk factors may affect the future operating and financial performance of the Group.
2 Refer to note 2.2 of the financial statements
3 2021 Sale of West Coast rent roll assets to Managex. Includes profit on sale of net assets disposed of $273K + Gain on exit of lease of $58K
4 AASB 16 Leases was adopted from 1 July 2019. The above demonstrates finance costs and amortisation, which prior to the adoption AASB 16
was recognised as rent expense. P a g e |5
ANNUAL REPORT THE AGENCY GROUP AUSTRALIA LTD 30 June 2022 AND CONTROLLED ENTITIES ABN 52 118 913 232
Directors’ report
a. Australian residential real estate market The Agency generates the majority of its income from the Australian residential real estate market. Revenue is generated in various forms such as Gross Commission Income which is generated on the sale of properties, property management commissions is received on collecting rent and other associated activities and commission payments on the arranging of mortgages. The risk of a reduction in sales transaction volumes or prices is a material risk for the Group and could result from general economic conditions and factors beyond the Company’s control such as housing affordability, employment, interest rates, domestic investor growth and demand, foreign investment and consumer confidence. As different states in Australia have different economic conditions at any one time, The Agency partly mitigates this risk through geographical diversification operating by operating in 6 states and territories across Australia.
b. People The Group operates in a highly competitive environment and there is a risk that the Group may not be able to recruit or retain quality staff to achieve its operational objectives or mitigate succession risk. The Group mitigates this risk through structured approach to recruitment, as well as providing competitive remuneration and incentive programs to attract and retain high performing talent across Sales, Property Management, Mortgage Broking, Support staff, and Corporate functions.
c. Reputation and brand The Group’s reputation and brand may be impacted from both a customer perspective and an investor perspective. The Agency Brand is a young, dynamic brand which is disrupting the existing status quo of selling real estate in Australia. The Group continues to invest in our customer proposition, using technology, training and processes to enhance our customers and agents experience to ensure a solid scalable platform for growth.
d. IT Systems and cyber risks The Group’s IT framework is a combination of proprietary systems and Software as a Service providers. The Group believes that the combination of these systems provides a competitive advantage and a foundation for scalable platform for growth. The Group’s operations are dependent on these systems which individually or collectively could fail or deliberately targeted which could lead to interruption of service, corruption of data or theft of personal data. The Agency mitigates against these risks through a combination of internal and outsourced IT professionals who maintain both preventative and detective processes and implements controls, including staff training to reduce the risk.
e. Impact of COVID 19 Coronavirus The COVID-19 coronavirus global pandemic has continued to cause significant disruption and restrictions to the movement of people and goods throughout the world. During the pandemic, The Agency implemented prudent business continuity measures to see it through which allowed it to continue to operate nationally and during the period has reaped the benefits of a rebounding real estate market.
5.5. Environmental Regulations The Group’s operations are not subject to any significant environmental regulations in the jurisdictions it operates in.
5.6. Events Subsequent to Reporting Date There are no other significant after balance date events that are not covered in this Directors’ Report or within the financial statements as disclosed in note 14 Events subsequent to reporting date on page 61.
a. Non-IFRS Pro forma balance sheet The following table illustrates the financial effect to the balance sheet of the Group had the following transactions (as disclosed in note 14 Events subsequent to reporting date) been applied at 30 June 2022: ◼ 14.1 Acquisition of Bushby & Co Pty Ltd (page 61) ◼ 14.2 Macquarie Bank Limited (“MBL”) Facility Amendment (page 61) ◼ 14.3 Variation to terms of financial liabilities – Convertible notes (page 61)
As a result of the transactions, pro forma working capital would be working capital of $0.87 million, reversing a working capital deficit of $8.43 million, as reported at 30 June 2022.
P a g e |6
THE AGENCY GROUP AUSTRALIA LTD ANNUAL REPORT AND CONTROLLED ENTITIES 30 June 2022 ABN 52 118 913 232
Directors’ report
Non-IFRS Pro forma balance sheet Unaudited Pro forma 30 June 30 June 2022 2022 $’000 $’000 Current assets Cash and cash equivalents 8,216 7,216 Trade and other receivables 11,103 11,103 Other current assets 497 2,370
Total current assets 19,816 20,689
Non-current assets Trade and other receivables 145 145 Financial assets 836 836 Property, plant, and equipment 1,936 2,230 Right of use assets 3,605 3,605 Intangible assets 21,315 24,193
Total non-current assets 27,837 31,009
Total assets 47,653 51,698
Current liabilities Trade and other payables 14,918 15,515 Borrowings 5,000 – Financial liabilities 4,021 – Provisions 2,472 2,472 Leases 1,836 1,836
Total current liabilities 28,247 19,823
Non-current liabilities Borrowings – 8,400 Financial liabilities – 4,021 Provisions 221 221 Leases 2,555 2,603 Deferred tax liabilities 230 230
Total non-current liabilities 3,006 15,475
Total liabilities 31,253 35,298
Net assets 16,400 16,400
Equity – – Issued capital 43,635 43,635 Reserves 890 890 Accumulated losses (28,125) (28,125)
Total equity 16,400 16,400
5.7. Future Developments, Prospects and Business Strategies The Group continues to focus on growth opportunities and attracting real estate agents to its contemporary direct engagement business model. By contracting directly with agents, the Group removes the ‘middle layer’ which has created a more responsive, efficient and effective model for our agents. This means our agents get a better deal and their clients get a better service.
P a g e |7
ANNUAL REPORT THE AGENCY GROUP AUSTRALIA LTD 30 June 2022 AND CONTROLLED ENTITIES ABN 52 118 913 232
Directors’ report
Future growth will come from growth in agent numbers, and increased efficiencies driven by economies of scale and utilisation of best practice technological advances to ensure agents can maximise their productivity. The highly fragmented structure of the industry presents an opportunity for consolidation and the Group believes additional growth will come from acquisition opportunities – a number of which are being assessed and can be funded by existing resources.
The Group continues to assess a variety of strategic partnerships and adjacent revenue opportunities closely related to the activities of real estate sales transactions in addition to the existing property management, mortgage broking and conveyancing businesses already undertaken.
6. Information relating to the Directors ◼ Mr Andrew Jensen Executive Chairman and Chief Operating Officer Non-independent Qualifications FIPA, MAICD Experience Mr Jensen previously held the position of Chief Financial Officer for International and leading Australian Companies, which will greatly assist the Company in its next phase of national growth under the two prominent brands of The Agency and Sell Lease Property. Mr Jensen has strong commercial, strategic, and M&A experience and has financially led companies engaged in various fields including real estate, financial services, tele- communications, and the franchising sectors both in Australia and Internationally. He is an accomplished CFO with over 18 years’ experience in senior finance and management roles. Previously, Mr Jensen was the CFO and Director of Australasia’s largest real estate group Ray White, with over $20 billion in annual sales and one of Australia’s largest independent mortgage broking businesses Loan Market. He has also been the CFO of VGC Food Group Pty Ltd, a private diversified manufacturing and franchising group. Mr Jensen was also CFO and COO of Digicel PNG (Papua New Guinea) part of Digicel Group Limited (Digicel), one of the South Pacific’s largest and most successful telecommunications companies. He is also a fellow of the Institute of Public Accountants and member of the Australian Institute of Company Directors.
Interest in Company equity Indirect 1,903,492 Ordinary Shares Directorships held in other Tombador Iron Limited (resigned 25 September 2020) listed entities during the prior three years
◼ Mr Geoff Lucas Managing Director and Chief Executive Officer Qualifications CPA, FAICD B Experience Mr Lucas is one of the most highly regarded executives in the Australian property industry, with a distinguished track record of leadership in a number of corporate positions for an ASX-listed real estate group, as well as other major public companies. With more than 25 years’ commercial experience, Mr Lucas has successfully grown several companies and uses his background in accounting and finance to develop and execute strategies for growth. From 2008-2016 Mr Lucas served as the Chief Operating Officer of McGrath Real Estate (ASX: MEA), later serving as Chief Executive Officer of the company. During this time he built deep connections within the real estate services industry, in addition to a keen understanding of how to build operations which foster and grow shareholder value. Prior to this, Mr Lucas served as the CEO of ASX-listed financial services group Credit Corp Group (ASX: CCP) from 2004 to 2008.
Interest in Company equity Indirect 30,000,000 Options Directorships held in other None listed entities during the prior three years prior
P a g e |8
THE AGENCY GROUP AUSTRALIA LTD ANNUAL REPORT AND CONTROLLED ENTITIES 30 June 2022 ABN 52 118 913 232
Directors’ report
◼ Mr Paul Niardone Executive Director Non-independent Qualifications MBA, BA B Experience Mr Niardone was one of the founders of The Agency and until January 2022 was the Managing Director but has opted to take up a more operational role as an Executive Director. He was formerly executive director and founder of Professional Public Relations (WA), the largest PR and communications firm in the State until he sold the business to WPP. Mr Niardone has experience in marketing and strategic planning for clients in both Government and the private sector. With a degree in Politics and Industrial Relations and a Master’s in Business Administration, he started his career in the Department of Cabinet and Parliamentary Services. He was appointed inaugural Manager of the Peel Region Business Enterprise Centre, and was then appointed as the first Marketing Manager for the entire Enterprise Centre Network comprising 36 centres throughout WA. Mr Niardone’s marketing skills were recognised by Westpac in its decision to appoint him as one of the first Business Banking Managers in Australia without a banking background. His career to date has provided him with a unique opportunity to gain experience, insights and contacts in a wide range of industries at the CEO and Board level. He has sat on the boards of a number of public and private companies and not for profit organisations.
Interest in Company equity Direct 8,000,000 Class A Performance Shares 3,000,000 Class B Performance Shares Indirect 3,187,008 Ordinary Shares Directorships held in other MinQuest Limited listed entities during the prior three years prior
◼ Mr Adam Davey Non-executive Director Non-independent Experience Mr Davey is a Director, Director – Wealth Management, Canaccord Genuity Financial Limited. Mr Davey’s expertise spans over 25 years and includes capital raising (both private and public), mergers and acquisition, ASX listings, asset sales and purchases, transaction due diligence and director duties. Mr Davey has been involved in significantly growing businesses in both the industrial and mining sector. This has been achieved through holding various roles within different organisations, including Chairman, Managing Director, Non-executive director, major shareholder or corporate adviser to the board. Mr Davey is also the Chairman of Teen Challenge Foundation, the largest Youth Drug and Alcohol Rehabilitation Centre in Western Australia.
Interest in Company equity Indirect 1,154,308 Ordinary Shares Directorships held in other Ensurance Limited listed entities during the Painchek Ltd prior three years prior
P a g e |9
ANNUAL REPORT THE AGENCY GROUP AUSTRALIA LTD 30 June 2022 AND CONTROLLED ENTITIES ABN 52 118 913 232
Directors’ report
Former directors ◼ Mr Matthew Lahood Executive Director Non-independent Experience Mr Lahood stepped down as Executive Director on 28 January 2022; however, he remains a key management person in the position as CEO – Real Estate. Mr Lahood is synonymous with Australian real estate, during more than two decades at the forefront of the industry, he has honed his expertise in everything from property sales to auctioneering. Having personally coached and mentored many of the industry’s finest sales agents to become million-dollar writers, Mr Lahood knows what it takes to significantly grow their businesses. He is also well known around Australia for his outstanding leadership skills and for building super sales and operational teams. He has been recognised with countless performance awards and is considered a thought leader within the Australian real estate space. Mr Lahood provides media commentary on a national level and is a regular keynote speaker at real estate and financial events. Mr Lahood’s love of real estate is only outshone by his passion for helping people grow personally and professionally. For over 28 years, he has stood firmly by his values of humility, transparency and integrity, values that he has passed onto many who have been lucky enough to work alongside him.
Interest in Company equity Indirect 24,804,398 Ordinary Shares (at date of resignation 28.01.2022) Directorships held in other Nil listed entities during the prior three years prior
7. Meetings of Directors and committees During the financial year, 10 meetings of Directors (including committees of Directors) were held. Attendances by each Director during the year are stated in the following table. DIRECTORS’ REMUNERATION AND FINANCE AND OPERATIONS AUDIT MEETINGS NOMINATION COMMITTEE COMMITTEE COMMITTEE Number Number Number Number eligible to Number eligible to Number eligible to Number eligible to Number attend Attended attend Attended attend Attended attend Attended Andrew Jensen 10 10 At the date of this report, the Audit, Nomination, and Finance and Operations Geoff Lucas 4 4 Committees comprise the full Board of Directors. The Directors believe the Company is Paul Niardone 10 10 not currently of a size nor are its affairs of such complexity as to warrant the Adam Davey 10 10 establishment of these separate committees. Accordingly, all matters capable of delegation to such committees are considered by the full Board of Directors. Matthew Lahood 6 5
8. Indemnifying officers or auditor 8.1. Indemnification The Company has paid premiums to insure each of the current and former Directors and officers against liabilities for costs and expenses incurred by them in defending any legal proceedings arising out of their conduct while acting in the capacity of Director or Officer of the Company, other than conduct involving a wilful breach of duty in relation to the Company. The Company has not given any further indemnity or entered into any other agreements to indemnify, or pay or agree to pay insurance premiums. No indemnities have been given or insurance premiums paid, during or since the end of the period, for any person who is or has been an auditor of the Company
8.2. Insurance premiums The contract of insurance prohibits disclosure of the nature of liability and the amount of the premium.
P a g e | 10
THE AGENCY GROUP AUSTRALIA LTD ANNUAL REPORT AND CONTROLLED ENTITIES 30 June 2022 ABN 52 118 913 232
Directors’ report
9. Options 9.1. Unissued shares under option At the date of this report, the unissued ordinary shares of the Company under option (listed and unlisted) are as follows: Grant Date Date of Expiry Exercise Price Number under Vested & $ Option Exercisable 29 Mar 2021 29 Sept 2022 0.050 10,000,000 10,000,000 29 Mar 2021 29 Sept 2023 0.075 10,000,000 – 29 Mar 2021 29 Sept 2024 0.100 10,000,000 –
30,000,000 10,000,000
On the commencement of employment, the Company granted Mr Lucas 30,000,000 options in accordance with his employment agreement. For further details refer to the financial statements note 18.2.2a. No person entitled to exercise the option has or has any right by virtue of the option to participate in any share issue of any other body corporate.
9.2. Shares issued on exercise of options No shares have been issued by the Company during the financial year as a result of the exercise of options (2021: nil).
10. Non-audit services During the year, Hall Chadwick WA Audit Pty Ltd (Hall Chadwick), the Company’s and Group’s auditor did not provide non-audit services (2021: $4,700), in addition to their statutory audits. Details of remuneration paid to the auditor can be found within the financial statements at note 19 Auditor’s Remuneration on page 66. Where non-audit services are provided by Hall Chadwick, the Board has established certain procedures to ensure that the provision of non-audit services are compatible with, and do not compromise, the auditor independence requirements of the Corporations Act 2001 (Cth). These procedures include: ◼ non-audit services will be subject to the corporate governance procedures adopted by the Company and will be reviewed by the Board to ensure they do not impact the integrity and objectivity of the auditor; and ◼ ensuring non-audit services do not involve reviewing or auditing the auditor’s own work, acting in a management or decision- making capacity for the Company, acting as an advocate for the Company or jointly sharing risks and rewards.
11. Proceedings on behalf of the Company No person has applied to the Court under section 237 of the Corporations Act 2001 (Cth) for leave to bring proceedings on behalf of the Company, or to intervene in any proceedings to which the Company is a party, for the purpose of taking responsibility on behalf of the Company for all or part of those proceedings. No proceedings have been brought or intervened in on behalf of the Company with leave of the Court under section 237 of the Corporations Act 2001 (Cth).
12. Rounding of amounts The amounts contained in this report have been rounded to the nearest thousand dollars under the option available to the Company under Australian Securities and Investments Commission Corporations (Rounding in Financial/Directors’ Reports) Instrument 2016/191 dated 24 March 2016.
12. Corporate Governance In recognising the need for the highest standards of corporate behaviour and accountability, the Directors of The Agency support and have substantially adhered to the best practice recommendations set by the ASX Corporate Governance Council. For a detailed analysis of the Company’s Corporate Governance Policies, visit the corporate governance section of our website at www.investors.theagency.com.au/corporate-governance.
13. Auditor’s independence declaration The lead auditor’s independence declaration under section 307C of the Corporations Act 2001 (Cth) for the year ended 30 June 2022 has been received and can be found on page 22 of the annual report.
P a g e | 11
ANNUAL REPORT THE AGENCY GROUP AUSTRALIA LTD 30 June 2022 AND CONTROLLED ENTITIES ABN 52 118 913 232
Directors’ report
14. Remuneration report (audited) This report outlines the remuneration arrangements in place for Directors and key management personnel of the Company for the year ended 30 June 2022. The information in this remuneration report has been audited as required by section 308(3C) of the Corporations Act 2001 (Cth).
14.1. Key management personnel (KMP) This remuneration report details the remuneration arrangements for KMP who are defined as those persons having authority and responsibility for planning, directing and controlling the major activities of the Company and the Group, directly or indirectly, including any director (whether Executive or otherwise) of the parent company, and includes those Executives in the Parent and the Group receiving the highest remuneration. KMP comprise the Directors of the Company and key executive personnel: ◼ Andrew Jensen Executive Chairman and Chief Operating Officer ◼ Geoff Lucas Managing Directors and Chief Executive Officer (CEO) (appointed MD 28 January 2022) ◼ Paul Niardone Executive Director ◼ Adam Davey Non-Executive Director ◼ Other KMP: Matt Lahood CEO – Real Estate ◼ Former KMP included in current and comparative information: Arjan van Ameyde Chief Financial Officer (CFO) (Resigned 1 February 2022)
14.2. Principles used to determine the nature and amount of remuneration a. Remuneration Policy The remuneration policy of The Agency Group Australia Limited has been designed to align director and management objectives with shareholder and business objectives by providing a fixed remuneration component, and offering specific long-term incentives, based on key performance areas affecting the Group’s financial results. The Board believes the remuneration policy to be appropriate and effective in its ability to attract and retain the best management and directors to run and manage the Group, as well as create goal congruence between directors, executives and shareholders. The remuneration policy, setting the terms and conditions for the executive directors and other senior executives, was developed by the Board. All remuneration paid to Directors and executives is valued at the cost to the Company and expensed. The Board policy is to remunerate non-executive Directors at the lower end of market rates for comparable companies for time, commitment, and responsibilities. The maximum aggregate amount of fees that can be paid to non-executive Directors is subject to approval by shareholders at the Annual General Meeting (AGM). Fees for non-executive Directors are not linked to the performance of the Group.
b. Performance Conditions Linked to Remuneration The Group seeks to establish and maintain The Agency Group Australia Limited Performance Rights Plan (Plan) to provide ongoing incentives to any full time or part time employee, consultant or any person nominated by the Board (including director or company secretary of the Company who holds salaried employment with the Company on a full or part time basis) (Eligible Participants) of the Company. The Board adopted the Plan to allow Eligible Participants to be granted Performance Rights to acquire shares in the Company. The objective of the Plan is to provide the Company with a remuneration mechanism, through the issue of securities in the capital of the Company, to motivate and reward the performance of Eligible Participants in achieving specified performance milestones within a specified performance period. The Board will ensure that the performance milestones attached to the securities issued pursuant to the Plan are aligned with the successful growth of the Company’s business activities.
c. Remuneration structure In accordance with best practice corporate governance, the structure of Non-Executive Director and Executive compensation is separate and distinct.
P a g e | 12
THE AGENCY GROUP AUSTRALIA LTD ANNUAL REPORT AND CONTROLLED ENTITIES 30 June 2022 ABN 52 118 913 232
Directors’ report
14. Remuneration report (audited) (1) Non-executive director remuneration The Board seeks to set aggregate remuneration at a level which provides the Company with the ability to attract and retain directors of the highest calibre, whilst incurring a cost which is acceptable to shareholders. The Constitution and the ASX Listing Rules specify that the aggregate remuneration of non‐executive directors shall be determined from time to time by a general meeting. An amount not exceeding the amount determined is then divided between the Directors as agreed. The latest determination was at the Annual General Meeting held on 29 April 2016 when shareholders approved an aggregate remuneration of $250,000 per year. The Board considers advice from external consultants when undertaking the annual review process.
(2) Executive remuneration Senior executives, including Executive Directors, are engaged under the terms of individual employment contracts. Such contracts are based upon standard terms drafted by the Company’s lawyers. Base salary/consulting fees are set to reflect the market salary for a position and individual of comparable responsibility and experience. Base salary/consulting fees are regularly compared with the external market and during recruitment activities generally. It is the policy of the Company to maintain a competitive salary structure to ensure continued availability of experienced and effective management and staff. Executives are prohibited from entering into transactions or arrangements which limit the economic risk of participating in unvested entitlements. Details of the nature and amount of each element of each Director, including any related company and each KMP are set out below.
d. Contractual arrangements of members of KMP (1) Executive Services Agreement (ESA) – Paul Niardone Mr Niardone entered into an ESA, revised on 11 January 2019, with the Company to be employed as Managing Director upon and subject to the terms and conditions of the ESA. On 28 January 2022, Mr Niardone stepped down as Managing Director was appointed Executive Director, focussed on continuing to grow Western Australian business, national growth of emerging SLP business, expansion of financial services division and advancing a range of technology focused Proptech opportunities. The key terms of this agreement are disclosed below: (A) Remuneration (i) Mr Niardone will receive a salary of $390,000 per year, exclusive of superannuation, which will be reviewed annually by the Company (Salary), plus an annual Director fee of $48,000 (as revised on 28 January 2022). The Company will make employer superannuation contributions on behalf of Mr Niardone. (ii) Mr Niardone, on the same basis of other Directors, may participate in a short-term and/or long-term incentive plans whether involving the issue of shares, options, rights or other incentives to Mr Niardone to remain at the Company and achieve the Company’s targets. Any such incentives will be governed by the relevant plan or scheme adopted by the Company. (iii) the Company will grant the Executive (or his nominee) the following 8,000,000 Class A Performance Rights and 3,000,000 Class B Performance Rights under its Performance Rights and Options Plan. The Class A and B Performance Rights will convert on the milestones as disclosed in 14.7.c Share-based compensation – Rights Granted as Remuneration. (iv) The Company paid operating lease payments for a motor vehicle, on behalf of Mr Niardone, in the amount of $24,297 for the year. (v) The Company shall provide to Mr Niardone, at its own cost, life insurance protection on similar terms to the life insurance protection currently offered by the Company. (vi) The Company will reimburse Mr Niardone for all reasonable travelling intra/interstate or overseas, accommodation, and general expenses incurred in the performance of all duties in connection with the business of the Company and its related bodies corporate. (vii) Mr Niardone is entitled to all leave in accordance with the National Employment Standard (NES) and Western Australian long service leave legislation. (B) Termination by the Company without reason The Company may at its sole discretion terminate employment by giving twelve months’ written notice and, at the end of that notice period, making a payment to Mr Niardone equal to the salary payable over a twelve- month period. The Company may elect to pay Mr Niardone the equivalent of the twelve months’ salary and dispense with the notice period (as revised on 11 January 2019).
P a g e | 13
ANNUAL REPORT THE AGENCY GROUP AUSTRALIA LTD 30 June 2022 AND CONTROLLED ENTITIES ABN 52 118 913 232
Directors’ report
14. Remuneration report (audited) (C) Termination by Mr Niardone Mr Niardone may at his sole discretion terminate the Employment in the following manner: (i) if at any time the Company commits any serious or persistent breach of any of the provisions contained in the ESA and the breach is not remedied within 28 days of receipt of written notice from Mr Niardone to the Company to do so, by giving notice effective immediately; or (ii) by giving three months’ written notice to the Company. (2) ESA – Matthew Lahood (A) Remuneration (i) Mr Lahood will receive a salary of $650,000 per year, exclusive of superannuation, which will be reviewed annually by the Company (Salary). (ii) In addition, the Company may at any time during the term of the ESA pay Mr Lahood a performance-based bonus over and above his salary. In determining the extent of any performance-based bonus, the Company shall take into consideration the key performance indicators of Mr Lahood and the Company, as the Company may set from time to time, and any other matter that it deems appropriate. (iii) The Company will make employer superannuation contributions on behalf of Mr Lahood. (iv) The Company will reimburse Mr Lahood for all reasonable travelling intra/interstate or overseas, accommodation, and general expenses incurred in the performance of all duties in connection with the business of the Company and its related bodies corporate. (v) Mr Lahood is entitled to all leave in accordance with the NES. (B) Termination by the Company without reason The Company may at its sole discretion terminate employment by giving three months’ written notice and, at the end of that notice period, making a payment to Mr Lahood equal to the salary payable over a five-month period. The Company may elect to pay Mr Lahood the equivalent of the six months’ salary and dispense with the notice period (C) Termination by Mr Lahood Mr Lahood may at his sole discretion terminate the Employment in the following manner: (i) if at any time the Company commits any serious or persistent breach of any of the provisions contained in the ESA and the breach is not remedied within 28 days of receipt of written notice from Mr Lahood to the Company to do so, by giving notice effective immediately; or (ii) by giving three months’ written notice to the Company. (3) Letter of Appointment – Adam Davey On 16 August 2016, Mr Davey executed a letter of appointment as non-executive Director of the Company: (A) Term Mr Davey’s service commenced on the date of completion of the acquisition of Ausnet Real Estate Services Pty Ltd by the Company and will cease when he resigns, retires or is removed from office in accordance with the Company’s constitution or the Corporations Act 2001 (Cth). (B) Fee Mr Davey will be paid a fee of $48,000 per annum for his role as a non-executive Director of the Company. Any fees paid to Mr Davey will in any event be subject to annual review by the Board of the Company and approval by Shareholders (if required). The Company will reimburse Mr Davey for all reasonable expenses incurred in performing his duties (4) Letter of Appointment – Andrew Jensen On 15 February 2019, Mr Jensen executed a letter of appointment as non-executive Director of the Company. (A) Term Mr Jensen’s service commenced from 18 February 2019, and will cease when he resigns, retires or is removed from office in accordance with the Company’s constitution or the Corporations Act 2001 (Cth). (B) Fee Mr Jensen will be paid a fee of $60,000 per annum for his role as a Director of the Company. Any fees paid to Mr Jensen will in any event be subject to annual review by the Board of the Company and approval by Shareholders (if required). The Company will reimburse Mr Jensen for all reasonable expenses incurred in performing his duties.
P a g e | 14
THE AGENCY GROUP AUSTRALIA LTD ANNUAL REPORT AND CONTROLLED ENTITIES 30 June 2022 ABN 52 118 913 232
Directors’ report
14. Remuneration report (audited) (5) Executive Services Agreement (ESA) – Andrew Jensen Mr Andrew Jensen entered into an ESA with the Company to be employed as Chief Operating Officer upon and subject to the terms and conditions of the ESA. The key terms of this agreement are disclosed below: (A) Remuneration (i) Mr Jensen will receive a salary of $350,000 per year, exclusive of superannuation, which will be reviewed annually by the Company (Salary). The Company will make employer superannuation contributions on behalf of Mr Jensen. (ii) Mr Jensen will continue to receive director’s fee as detailed in (4) above. (iii) In addition, the Company may at any time during the term of the ESA pay Mr Jensen a performance-based bonus over and above his salary. In determining the extent of any performance-based bonus, the Company shall take into consideration the key performance indicators of Mr Jensen and the Company, as the Company may set from time to time, and any other matter that it deems appropriate. (iii) The Company will reimburse Mr Jensen for all reasonable travelling intra/interstate or overseas, accommodation, and general expenses incurred in the performance of all duties in connection with the business of the Company and its related bodies corporate. (iv) Mr Jensen is entitled to all leave in line with the NES and Western Australian long service leave legislation. (B) Termination by the Company without reason The Company may at its sole discretion terminate employment by giving three months’ written notice and, at the end of that notice period, making a payment to Mr Jensen equal to the salary payable over a three-month period. The Company may elect to pay Mr Jensen six months’ salary and dispense with the notice period (C) Termination by Mr Jensen Mr Jensen may at his sole discretion terminate the Employment in the following manner: (i) if at any time the Company commits any serious or persistent breach of any of the provisions contained in the ESA and the breach is not remedied within 28 days of receipt of written notice from Mr Jensen to the Company to do so, by giving notice effective immediately; or (ii) by giving two months’ written notice to the Company. (6) Executive Services Agreement (ESA) – Arjan Van Ameyde (Resigned 1 February 2022) Mr Van Ameyde entered into an ESA, revised on 11 December 2019 (commencing 1 February 2020), with the Company as Chief Financial Officer subject to the terms and conditions of the ESA. Mr Van Ameyde resigned on 1 February 2022. The key terms of his agreement are applicable to the reporting periods are disclosed below: (A) Remuneration (i) Mr Van Ameyde will receive a salary of $250,000 per year, exclusive of superannuation, which will be reviewed annually by the Company (Salary). (ii) Mr Van Ameyde shall be entitled to payment of $10,000 following the one-year anniversary of the 1 February 2020, subject to achievement by the CFO of key performance indicators. (iii) In addition, the Company may at any time during the Term pay to Mr Van Ameyde a performance-based bonus over and above the Salary (iv) Mr Van Ameyde shall be entitled to participate in an Executive Share Scheme (v) The Company will make employer superannuation contributions on behalf of Mr Van Ameyde and will reimburse Mr Van Ameyde for all reasonable travelling, accommodation, and general expenses incurred in the performance of all duties. (vi) Mr Van Ameyde is entitled to all leave in line with the NES and Western Australian long service leave legislation. (B) Termination by the Company without reason The Company may at its sole discretion terminate employment by giving three months’ written notice and at the end of that notice period, making a payment to Mr Van Ameyde of one month’s salary. The Company may elect to pay Mr Van Ameyde the equivalent of the four months’ salary and dispense with the notice period. (C) Termination by Mr Van Ameyde Mr Van Ameyde may at his sole discretion terminate the Employment in the following manner: (i) if at any time the Company commits any serious or persistent breach of any of the provisions contained in the ESA and the breach is not remedied within 28 days of receipt of written notice from Mr Van Ameyde to the Company to do so, by giving notice effective immediately; or (ii) by giving three months’ written notice to the Company.
P a g e | 15
ANNUAL REPORT THE AGENCY GROUP AUSTRALIA LTD 30 June 2022 AND CONTROLLED ENTITIES ABN 52 118 913 232
Directors’ report
14. Remuneration report (audited) (7) Employment Agreement (EA) – Geoff Lucas Mr Geoff Lucas entered into an EA, commencing on 29 March 2021, with the Company to be employed as Chief Executive Officer upon and subject to the terms and conditions of the EA. On 28 January 2022, Mr Lucas was appointed Managing Director of the Company. The key terms of this agreement are disclosed below: (A) Salary Package $550,000 inclusive of superannuation (not to increase for first 2 years of employment), plus short term and long-term incentive payments which will be subject to achievement of key performance indicators to be set and approved with and by the Board. (B) Leave provisions In accordance with applicable legislation. (C) Equity issues Upon commencement, the Company will issue Mr Lucas with 30 million unlisted options to acquire fully paid ordinary shares of the Company with the following terms: ◼ 10 million exercisable at 5 cents each, vesting 60 days after conclusion of a 6-month probationary period (Probationary Period) and are exercisable on or before 12 months after conclusion of the probationary period (approx. September 2022). ◼ 10 million exercisable at 7.5 cents each, vesting on the 12-month anniversary date of conclusion of the Probationary Period and are exercisable on or before 12 months from vesting (approx. September 2023). ◼ 10 million exercisable at 10 cents each, vesting on the 24-month anniversary date of conclusion of the Probationary Period and are exercisable on or before 12 months from vesting (approx. September 2024). If the employment is terminated by either party, the Unlisted Options will be cancelled or lapsed. If all Unlisted Options are exercised the total payable by Mr Lucas will be $2.25 million. (D) Termination Following the Probationary Period, the Company may terminate the employment without cause, or Mr Lucas may resign from the employment, with six months’ written notice to the other party. The employment agreement also contains summary termination provisions considered standard for an agreement of this type. e. Voting and comments made at the Company’s 2021 Annual General Meeting (AGM) At the AGM held on 28 January 2022, on a poll the Company received 246,658,294 (99.40%) For votes and 1,495,512 (0.06%) Against votes and no abstentions on its remuneration report for the 2021 financial year. The Group did not employ a remuneration consultant during the year. 14.3. Performance-based remuneration a. The following table provides employment details of persons who were, during the financial year, members of KMP of the Group. The table also illustrates the proportion of remuneration that was performance based and the proportion of remuneration received in the form of options. Position Held as at Contract Proportions of Elements of Proportions of Elements of Total Group KMP 30 June 2022 and any Commencement / Remuneration Related to Performance Remuneration Not Related change during the Termination Date to Performance year Non-salary Fixed Salary/ Fixed Salary/ Cash-based Options / Fees – cash Fees – share- Incentives Shares Rights based based % % % % % % Andrew Jensen Executive Chairman Appt. 18.02.2019 (Dir) 7 – – 93 – 100 and COO Appt. 1.02.2020 (COO) Paul Niardone Executive Director 11.01.2019 7 – 16 77 – 100 Adam Davey Non-Executive 16.08.2016 – – – 100 – 100 Director Geoff Lucas Managing Director Appt. 28.01.2022 (MD) 6 – – 46 48 100 and CEO Appt. 29.03.2021 (CEO) Matthew Lahood(1) CEO – Real estate Appt 17.02.2019 13 – – 87 – 100 Arjan van Ameyde Chief Financial Appt. 1.02.2020 – – – 100 – 100 Officer Resigned 1.02.2022 (1) Mr Lahood stepped down as Executive Director on 28 January 2022; however, he remains a key management person in the position as CEO – Real Estate.
P a g e | 16
THE AGENCY GROUP AUSTRALIA LTD ANNUAL REPORT AND CONTROLLED ENTITIES 30 June 2022 ABN 52 118 913 232
Directors’ report
14. Remuneration report (audited)
b. Statutory performance indicators The Group aims to align our executive remuneration to our strategic and business objectives and the creation of shareholder wealth. Reported below are measures of the Group’s financial performance over the last five years as required by the Corporations Act 2001 (Cth). However, these are not necessarily consistent with the measures used in determining the variable amounts of remuneration to be awarded to KMPs. As a consequence, there may not always be a direct correlation between the statutory key performance measures and the variable remuneration awarded.
2022 2021 2020 2019 2018
Profit / (loss) for the year attributable to 1,588 (1,856) (9,065) (7,831) (3,742) owners of the Company ($’000) Basic earnings per share (cents) 0.37 (0.53) (3.60) (12.71) (17.58) Dividend payments ($) Nil Nil Nil Nil Nil Dividend payout ratio (%) N/A N/A N/A N/A N/A Share price ($) 0.037 0.050 0.043 0.070 0.148 Increase/(decrease) in share price (%) (26.00) 16.28 (38.57) (52.70) (65.34)
14.4. Directors and KMP remuneration Details of the nature and amount of each element of the remuneration of each of the KMP of the Company (the Directors) for the year ended 30 June 2022 are set out in the following tables: Bonuses paid during the year were based on the achievement of agreed key performance indicators. The following table of benefits and payments represents the components of the current year and comparative year remuneration expenses for each member of KMP of the Group. Such amounts have been calculated in accordance with Australian Accounting Standards. 2022 – Group Short-term benefits Post- Long-term Termination Equity-settled share- Total Group KMP employment benefits benefits based payments benefits Salary, fees Profit share Non- Other Super- Other Shares Options / and leave & bonuses(4) monetary annuation Perf. equity $ $ $ $ $ $ $ $ $ $ Andrew Jensen 410,002 33,621 – – 23,568 – – – – 467,191 Paul Niardone(2)(3) 469,216 44,041 – 24,297 23,568 – – – 110,558 671,680 Adam Davey 48,000 – – – – – – – – 48,000 Geoff Lucas(2) 526,427 68,064 – – 23,568 – – – 563,995 1,182,054 Matthew Lahood 613,995 97,668 – 36,000 23,568 – – – – 771,231 Arjan van Ameyde(1) 147,754 – – – 15,502 – 122,993 – – 286,249
2,215,394 243,394 – 60,297 109,774 – 122,993 – 674,553 3,426,405 (1) Mr Ameyde resigned 1 February 2022. (2) Included in Salary, fees and leave for Mr Niardone is an amount of $59,216 relating to a payout of leave entitlements, and director fees of $20,000. (3) Mr Niardone was issued performance rights in accordance with his ESA. For further details, refer 18.2.1. Mr Lucas’ options were issued in accordance with his employment agreement. For further details refer to the financial statements note 18.2.2a. (4) Bonuses for the current year are accrued but unpaid as at 30 June 2022. Bonuses are subject to final Board approval.
P a g e | 17
ANNUAL REPORT THE AGENCY GROUP AUSTRALIA LTD 30 June 2022 AND CONTROLLED ENTITIES ABN 52 118 913 232
Directors’ report
14. Remuneration report (audited) 2021 – Group Short-term benefits Post- Long-term Termination Equity-settled share- Total Group KMP employment benefits benefits based payments benefits Salary, fees Profit share Non- Other Super- Other Share Options / and leave & bonuses(3) monetary annuation Perf. equity $ $ $ $ $ $ $ $ $ $ Andrew Jensen 410,000 111,508 – – 21,694 – – – – 543,202 Paul Niardone 399,000 123,508 – 25,576 21,694 – – – – 569,778 Adam Davey 48,000 – – – – – – – – 48,000 Matthew Lahood 563,181 86,940 – 25,500 21,694 – – – – 697,315 Geoff Lucas(1) (2) 116,498 – – – 5,424 – – – 215,946 337,868 Arjan van Ameyde 250,000 10,000 – – 21,694 – – – – 281,694
1,786,679 331,956 – 51,076 92,200 – – – 215,946 2,477,857 (1) Appointed 29 March 2021 (2) On the commencement of employment, the Company granted Mr Lucas 30,000,000 options in accordance with his employment agreement. Of the 30,000,000 options, 10,000,000 options have vested and are exercisable, as detailed in statements note 18.2.2a. (3) Bonuses for the 2021 financial year have been restated to reflect an accrual basis of accounting. Previously report amounts in the remuneration report had been presented on a cash basis. The change only affects the remuneration report and related notes and has no effect on profit and loss which was presented including these amounts.
14.5. KMP Loans As a 30 June 2022, an amount outstanding of $345,009 was advanced to Mr Lahood (2021: nil), with the following terms: ◼ Principal Sum Up to $400,000 ◼ Loan Commencement 27 October 2021 ◼ Interest Rate 8% per annum (after 12 months interest free period from final advance date). ◼ Default Interest Rate Interest Rate plus 5% per annum. ◼ Securities Any future sales commissions and future income and wages as per EA entitlements. ◼ Instalment Date Amount is due on final repayment date or when any due amounts are payable on STI payments and sales commissions from property sales that are due. Discretional payments during the term can also be paid. ◼ Repayment Date 31 March 2023
14.6. Other transactions with KMP and or their Related Parties Some Directors or former Directors of the Group hold or have held positions in other companies, where it is considered they control or significantly influence the financial or operating policies of those entities. During the year, the following entities provided services to the Group. Total Transactions Receivable/(Payable) Balance Entity Nature of transactions KMP 2022 2021 2022 2021 $ $ $ $ Chapter One Advisers16a Public Relations Paul Niardone – 7,000 N/A N/A Matt Lahood Advance commissions / Matt Lahood (26,704) 90,000 57,370 84,074 Future fund (1) Chapter One Advisers discontinued to be a related entity in July 2020 as Mr Niardone ceased to have any control or significantly influence the financial or operating policies of Chapter One Advisers.
There have been no other transactions in addition to those described in the tables above or as detailed in note 16 Related party transactions.
P a g e | 18
THE AGENCY GROUP AUSTRALIA LTD ANNUAL REPORT AND CONTROLLED ENTITIES 30 June 2022 ABN 52 118 913 232
Directors’ report
14. Remuneration report (audited) 14.7. Share-based compensation The Group believes that encouraging its directors and executives to become shareholders is the best way of aligning their interests with those of its shareholders. At present the Group does not have an active employee share option plan. There were no equity instruments issued during the year to Directors as a result of options exercised that had previously been granted as compensation.
a. Securities received that are not performance-related No members of KMP are entitled to receive securities that are not performance-based as part of their remuneration package. b. Options and Rights Granted as Remuneration No options were granted during the current financial year. During 2021 financial year, 30,000,000 options were granted to Mr Geoff Lucas as share-based compensation, as detailed below and in note 18.2.2a. Value per option at Grant Vested during Exercised during Number under Exercise Price Date the year the year Option Grant Date Vesting Date Expiry Date $ $ No. No. 10,000,000 29.03.21 28.11.21 29.09.22 0.050 0.0320 10,000,000 nil 10,000,000 29.03.21 29.09.22 29.09.23 0.075 0.0333 – nil 10,000,000 29.03.21 29.09.23 29.09.24 0.100 0.036 – nil
c. Rights Granted as Remuneration At the Company’s 2021 AGM, shareholder approval was obtained to issue 11,000,000 performance rights that will convert into shares upon milestones being achieved, to Mr Paul Niardone under his ESA. These performance rights have been issued on terms as detailed below and valued in accordance with note 18.3. Class of Performance Condition Performance Milestone Expiry Probability of Performance Performance rights Date Date milestones met Condition Right No. % Satisfied A 24 months continuous service to the 8,000,000 28.01.2024 28.01.2024 100 No Company B Achievement of one of the following: 3,000,000 30.06.2024 30.06.2024 85 No (i) recruitment by The Agency (WA) and the Company’s Sell Lease Property Model of 85 Agents by 30 June 2024; or (ii) achievement of GCI of $50,000,000 for the financial year ending 30 June 2024 by The Agency (WA).
14.8. KMP equity holdings a. Fully paid ordinary shares of The Agency Group Australia Ltd held by each KMP The number of ordinary shares of The Agency Group Australia Ltd held, directly, indirectly or beneficially, by each KMP, including their personally-related entities for the year ended 30 June 2022 is as follows: 2022 – Group Balance at start of Received during Received during the year or the year as year on the exercise Other changes Balance at end of Group KMP appointment compensation of options during the year year or resignation No. No. No. No. No. Andrew Jensen 1,903,492 – – – 1,903,492 Paul Niardone(2) 3,187,007 – – 1 3,187,008 Adam Davey(2) 1,154,307 – – 1 1,154,308 Geoff Lucas – – – – – Matthew Lahood 24,804,398 – – – 24,804,398 Arjan van Ameyde(1) – – – – –
31,049,204 – – 2 31,049,206 (1) Mr Ameyde resigned 1 February 2022. (2) Other changes relate to performance shares that failed to vest and converted to two only ordinary shares during the year.
P a g e | 19
ANNUAL REPORT THE AGENCY GROUP AUSTRALIA LTD 30 June 2022 AND CONTROLLED ENTITIES ABN 52 118 913 232
Directors’ report
14. Remuneration report (audited) b. Options in The Agency Group Australia Ltd held by each KMP The number of options over ordinary shares in The Agency Group Australia Ltd held, directly, indirectly or beneficially, by each KMP, including their personally-related entities for the year ended 30 June 2022 is as follows:
2022 – Group Balance at Granted as Balance at start of year or Remuneration Exercised Other changes end of year or Vested and Group KMP appointments during the year during the year during the year(2) resignation Exercisable Not Vested No. No. No. No. No. No. No. Andrew Jensen – – – – – – – Paul Niardone – – – – – – – Adam Davey 333,333 – – (333,333) – – – Geoff Lucas 30,000,000 – – – 30,000,000 10,000,000 20,000,000 Matthew Lahood – – – – – – Arjan van Ameyde(1) – – – – – – –
30,333,333 – – (333,333) 30,000,000 10,000,000 20,000,000 (1) Mr Ameyde resigned 1 February 2022. (2) Other changes relate to the expiration of options
c. Performance Shares / Rights of The Agency Group Australia Ltd held by each KMP The number of Performance Shares in The Agency Group Australia Ltd held, directly, indirectly or beneficially, by each KMP, including their personally-related entities for the year ended 30 June 2022 is as follows:
2022 – Group Balance at Received during Conversion to Balance at start of year or the year as ordinary share Other changes end of year or Maximum value Group KMP appointments compensation during the year during the year(1) resignation yet to vest No. No. No. No. No. No. Andrew Jensen – – – – – – Paul Niardone(2) 411,111 11,000,000 – (411,111) 11,000,000 11,000,000 Adam Davey 266,667 – – (266,667) – – Geoff Lucas – – – – – – Matthew Lahood – – – – – – Arjan van Ameyde(3) – – – – – –
677,778 11,000,000 – (677,778) 11,000,000 11,000,000 (1) Other changes related to performance shares that failed to vest and expired in a prior period. These performance shares converted to two only ordinary shares during the year. (2) Mr Niarodone was issued performance rights (8 million Class A and 3 million Class B) in accordance with his ESA. For further details, refer 18.2.1. (3) Mr Ameyde resigned 1 February 2022.
P a g e | 20
THE AGENCY GROUP AUSTRALIA LTD ANNUAL REPORT AND CONTROLLED ENTITIES 30 June 2022 ABN 52 118 913 232
Directors’ report
14. Remuneration report (audited) 14.9. Other Equity-related KMP Transactions There have been no other transactions involving equity instruments other than those described in the tables above relating to options, rights, and shareholdings.
END OF REMUNERATION REPORT
This Report of the Directors, incorporating the Remuneration Report, is signed in accordance with a resolution of the Board of Directors made pursuant to section 298(2) of the Corporations Act 2001 (Cth).
GEOFF LUCAS Managing Director and CEO Dated this Wednesday, 24 August 2022
P a g e | 21
ANNUAL REPORT THE AGENCY GROUP AUSTRALIA LTD 30 June 2022 AND CONTROLLED ENTITIES ABN 52 118 913 232
Auditor’s independence declaration Under section 307c Of The Corporations Act 2001 (Cth) To The Directors Of THE AGENCY GROUP AUSTRALIA LTD
TO BE RECEIVED FROM AUDITORS
P a g e | 22
THE AGENCY GROUP AUSTRALIA LTD ANNUAL REPORT AND CONTROLLED ENTITIES 30 June 2022 ABN 52 118 913 232
Consolidated statement of profit or loss and other comprehensive income for the year ended 30 June 2022 Note 2022 2021 $’000 $’000 Continuing operations Revenue 1.1 72,656 58,380 Cost of sales (47,432) (35,654)
Gross profit 25,224 22,726
Other income 1.2 776 1,511
Administrative and other expenses (26,263) (23,332) Impairment losses recovered / (expensed) 2.3 400 (400)
Profit before tax and finance costs 137 505
Interest and finance costs (816) (2,011) Embedded derivative non-cash financing gains / (costs) 2.2 1,140 (2,244)
Profit / (loss) before tax 2.1 461 (3,750)
Income tax benefit 4.1 1,127 1,894
Net profit / (loss) for the year 1,588 (1,856)
Other comprehensive income, net of income tax ◼ Items that will not be reclassified subsequently to profit or loss: – – ◼ Items that may be reclassified subsequently to profit or loss: – –
Other comprehensive income for the period, net of tax – –
Total comprehensive income attributable to members of the parent entity 1,588 (1,856)
Earnings per share: ₵ ₵ Basic earnings per share (cents per share) 17.4 0.37 (0.53) Diluted earnings per share (cents per share) 17.4 0.37 N/A 5,687 6,367 The consolidated statement of profit or loss and other comprehensive income is to be read in conjunction with the accompanying notes.
P a g e | 23
ANNUAL REPORT THE AGENCY GROUP AUSTRALIA LTD 30 June 2022 AND CONTROLLED ENTITIES ABN 52 118 913 232
Consolidated statement of financial position as at 30 June 2022 Note 2022 2021 $’000 $’000 Current assets Cash and cash equivalents 5.1 8,216 5,096 Trade and other receivables 5.2.1 11,103 8,354 Other current assets 5.4.1 497 324
Total current assets 19,816 13,774
Non-current assets Trade and other receivables 5.2.2 145 163 Financial assets 5.3.1 836 613 Property, plant, and equipment 6.1 1,936 1,578 Right of use assets 6.2.1 3,605 4,894 Intangible assets 6.3 21,315 24,240
Total non-current assets 27,837 31,488
Total assets 47,653 45,262
Current liabilities Trade and other payables 5.5.1 14,918 11,194 Borrowings 5.6.1 5,000 – Financial liabilities 5.7.1 4,021 – Provisions 6.4 2,472 2,565 Leases 6.2.2 1,836 1,828
Total current liabilities 28,247 15,587
Non-current liabilities Borrowings 5.6.2 – 5,000 Financial liabilities 5.7.2 – 4,883 Provisions 6.4 221 281 Leases 6.2.2 2,555 4,017 Deferred tax liabilities 4.6 230 1,357
Total non-current liabilities 3,006 15,538
Total liabilities 31,253 31,125
Net assets 16,400 14,137
Equity – – Issued capital 7.1.1 43,635 43,635 Reserves 7.4 890 1,072 Accumulated losses (28,125) (30,570)
Total equity 16,400 14,137 (8,431) (1,813) (4,685) (8,746) The consolidated statement of financial position is to be read in conjunction with the accompanying notes.
P a g e | 24
THE AGENCY GROUP AUSTRALIA LTD ANNUAL REPORT AND CONTROLLED ENTITIES 30 June 2022 ABN 52 118 913 232
Consolidated statement of changes in equity for the year ended 30 June 2022 Note Share-based Contributed Accumulated payment Total equity Losses Reserve equity $’000 $’000 $’000 $’000
Balance at 1 July 2020 39,396 (28,714) 929 11,611 Loss for the year attributable owners of the parent – (1,856) – (1,856) Other comprehensive income for the year attributable owners of the parent – – – – Total comprehensive income for the year attributable owners of the parent – (1,856) – (1,856)
Transaction with owners, directly in equity Shares issued during the year (net of costs) 7.1.1 3,553 – – 3,553 Options granted during the year 7.3 – – 438 438 Options exercised during the year 7.1.1,7.3 686 – (295) 391
Balance at 30 June 2021 43,635 (30,570) 1,072 14,137
Balance at 1 July 2021 43,635 (30,570) 1,072 14,137 Profit for the year attributable owners of the parent – 1,588 – 1,588 Other comprehensive income- for the year attributable owners of the parent – – – –
Total comprehensive income for the year attributable owners of the parent – 1,588 – 1,588
Transaction with owners, directly in equity Shares issued during the year (net of costs) – – – – Share-based payments granted during the year 18 – – 675 675 Transfers to / from reserves – 857 (857) –
Balance at 30 June 2022 43,635 (28,125) 890 16,400
The consolidated statement of changes in equity is to be read in conjunction with the accompanying notes.
P a g e | 25
ANNUAL REPORT THE AGENCY GROUP AUSTRALIA LTD 30 June 2022 AND CONTROLLED ENTITIES ABN 52 118 913 232
Consolidated statement of cash flows for the year ended 30 June 2022 Note 2022 2021 $’000 $’000 Cash flows from operating activities Receipts from customers 78,861 71,571 Payments to suppliers and employees (71,827) (65,947) Interest received 37 18 Finance costs (471) (999)
Net cash provided by operating activities 5.1.2a 6,600 4,643
Cash flows from investing activities Purchase of property, plant, and equipment (965) (242) Deposit for bank guarantees (11) – Purchase of intangibles (319) – Loans to other entities (715) (225) Net cash received on disposal of asset group 486 2,623
Net (cash used) / provided by investing activities (1,524) 2,156
Cash flows from financing activities Proceeds from exercise of options – 392 Share issue costs – (60) Repayments of borrowings 5.1.2b – (7,843) Proceeds from borrowings 5.1.2b – 5,000 Payment of principal portion of lease liabilities (1,956) (1,916)
Net cash used in financing activities (1,956) (4,427)
Net increase in cash and cash equivalents held 3,120 2,372 Cash and cash equivalents at the beginning of the year 5,096 2,724
Cash and cash equivalents at the end of the year – 5.1 8,216 5,096
The consolidated statement of cash flows is to be read in conjunction with the accompanying notes.
P a g e | 26
THE AGENCY GROUP AUSTRALIA LTD ANNUAL REPORT AND CONTROLLED ENTITIES 30 June 2022 ABN 52 118 913 232
Notes to the consolidated financial statements for the year ended 30 June 2022
In preparing the 2022 financial statements, The Agency Group Australia Ltd has grouped notes into sections under five key categories: ◼ Section A: How the numbers are calculated ……………………………………………………………………………………………………………..28
◼ Section B: Risk ………………………………………………………………………………………………………………………………………………………54
◼ Section C: Group structure ……………………………………………………………………………………………………………………………………..58
◼ Section D: Unrecognised items ……………………………………………………………………………………………………………………………….61
◼ Section E: Other Information ………………………………………………………………………………………………………………………………….62 Significant accounting policies specific to each note are included within that note. Accounting policies that are determined to be non-significant are not included in the financial statements. The financial report is presented in Australian dollars, except where otherwise stated. The amounts contained in these financial statements have been rounded to the nearest thousand dollars under the option available to the Group under Australian Securities and Investments Commission (ASIC) Corporations (Rounding in Financial/Directors’ Reports) Instrument 2016/191 dated 24 March 2016. Change in Presentation During the financial year the Group changed the presentation of the statement of profit and loss to classify expenses based on their function. This change has not affected reported profit or loss and is a change in presentation only. In accordance with accounting standards, the Group will continue to report expenditure classified by nature in the notes to the consolidated financial statements, as disclosed in 2.1 Expenses by nature. Comparative information has been updated to reflect this change.
P a g e | 27
ANNUAL REPORT THE AGENCY GROUP AUSTRALIA LTD 30 June 2022 AND CONTROLLED ENTITIES ABN 52 118 913 232
Notes to the consolidated financial statements for the year ended 30 June 2022
SECTION A. HOW THE NUMBERS ARE CALCULATED This section provides additional information about those individual line items in the financial statements that the Directors consider most relevant in the context of the operations of the entity, including: (a) accounting policies that are relevant for an understanding of the items recognised in the financial statements. These cover situations where the accounting standards either allow a choice or do not deal with a particular type of transaction. (b) analysis and sub-totals. (c) information about estimates and judgements made in relation to particular items.
Note 1 Revenue and other income Note 2022 2021 $’000 $’000
1.1 Revenue Residential Sales commissions 60,682 46,443 Mortgage and Settlement revenue 5,115 4,422 Property Management revenue: Management fees 1.1.1 5,116 5,732 Other 1.1.1 1,743 1,783
72,656 58,380 1.1.1 As detailed in note 1.2.1, in September 2020, the Group sold its WA rent roll business. This contributed $399K to Management Fees and $176K to Other fees of the comparative period’s Property Management revenue.
1.2 Other Income Note 2022 2021 $’000 $’000 Interest income 37 19 Profit on sale of net assets disposed 1.2.1 – 124 Gain on exit of lease 5 77 Gain financial assets at FVPL 123 – Other income 611 567 Government grants received – Cash Flow Boost – 724
776 1,511 1.2.1 In September 2020, the Group sold The Agency Property Management WA Pty Ltd that held the Group’s West Coast rent roll net assets resulting in the following gain: 2021 $’000 Consideration: Cash payment 2,777 Retention receivable 335
Total consideration 3,112 Less: Costs associated with sale (51) Net assets disposed (2,937)
Profit on sale of net assets disposed 124
1.3 Accounting policies 1.3.1 Revenue from contracts with customers Revenue is measured based on the consideration specified in a contract with a customer. The Group recognises revenue when performance obligations have been met. Revenue is measured at the fair value of the consideration received or receivable. Amounts disclosed as revenue are net of returns, trade allowances and amounts collected on behalf of third parties.
P a g e | 28
THE AGENCY GROUP AUSTRALIA LTD ANNUAL REPORT AND CONTROLLED ENTITIES 30 June 2022 ABN 52 118 913 232
Notes to the consolidated financial statements for the year ended 30 June 2022
Note 1 Revenue and other income (cont.) 1.3.2 Revenue is recognised for major business activities based on the following performance obligations: a. Settlement fee revenue ……………………………………. on settlement of real estate transaction. b. Upfront commissions for mortgage origination …… on approval of finance to clients and settlement of real estate transaction. c. Trail commissions ……………………………………………… on receipt, based on maintaining clientele. d. Real estate commissions ……………………………………. when the sale of the property becomes unconditional. e. Training seminars and functions ………………………… on date function is held All revenue is stated net of the amounts of goods and services tax (GST).
1.3.3 Interest income Interest revenue is recognised in accordance with note 3.1 Finance income and expenses.
1.3.4 Government Grants Grants from the government are recognised at their fair value where there is a reasonable assurance that the grant will be received, and the Group will comply with all attached conditions. a. The Group received government grants from the Australian Government’s JobKeeper Payment and Cash Flow Boost schemes. There are no unfulfilled conditions or other contingencies attaching to these grants. Grants related to income are presented as part of profit or loss as a deduction in reporting the related expense (refer note 2.4).
1.3.5 Critical judgements – Recognition of trailing commission revenue & trailing commission expense The Group receives trailing commissions from lenders on loans they have settled that were originated by the Group. The trailing commissions are received over the life of the loans based on the individual loan balance outstanding. The Group also makes trailing commission payments to brokers based on the individual loan balance outstanding.). As disclosed in note 1.3.2c above, revenue from trailing commission is recognised on receipt. The Directors considered the detailed criteria for the recognition of revenue from the rendering of services set out in AASB 15 Revenue from contracts with customers, in particular, whether the recognition of revenue on the trail satisfied the probability requirements. The Directors determined that at the contract level, the Group cannot reliably determine the likelihood of that individual remaining with the Group or the period that they will continue for, resulting in revenue only being recognised upon receipt. Trailing commission expenditure is recognised on the same basis as trailing commission revenue and is recognised upon receipt of trailing commission revenue.
Note 2 Expenses Note 2022 2021 $’000 $’000 2.1 Expenses by nature ◼ Advertising and promotion expenses 2,282 1,640 ◼ Computers and information technology expenses 1,864 1,407 ◼ Consultancy fees 1,265 2,048 ◼ Depreciation and amortisation 2.5 5,440 5,466 ◼ Embedded derivative non-cash financing (gains) / costs 2.2 (1,140) 2,244 ◼ Impairment (recovery) / expense 2.3 (400) 400 ◼ Interest and finance costs 816 2,011 ◼ Legal and professional fees 918 1,328 ◼ Occupancy costs 818 571 ◼ Salaries and employment costs 2.4 58,227 44,398 ◼ Other expenses 2,881 2,128
Total expenses by nature 72,971 63,641
P a g e | 29
ANNUAL REPORT THE AGENCY GROUP AUSTRALIA LTD 30 June 2022 AND CONTROLLED ENTITIES ABN 52 118 913 232
Notes to the consolidated financial statements for the year ended 30 June 2022
Note 2 Expenses (cont.) 2.1 Expenses by nature (cont.) Note 2022 2021 $’000 $’000 2.1.1 Reconciliation to net profit or loss before tax Total revenue and other income 73,432 59,891 Less: Total expenses by nature (72,971) (63,641)
Net profit before tax 461 (3,750) – –
2.2 Embedded derivative non-cash financing (gains)/costs: ◼ Embedded Derivative – Finance cost 866 257 ◼ Embedded Derivative – Fair value adjustment 5.7.3 (2,006) 1,987
(1,140) 2,244
2.3 Impairment: ◼ Doubtful debts expense / (recovered) 5.4.1 (400) 400
(400) 400 2.3.1 Accounting policy a. Impairment of financial assets Refer to note 5.8.1d b. Impairment of non-financial assets Refer to note 6.5.1
2.4 Salaries and employment costs Note 2022 2021 $’000 $’000 ◼ Commissions 39,118 31,656 ◼ Director fees 149 144 ◼ Salary and wages 11,340 7,899 ◼ Share-based payments expense 18 675 216 ◼ Superannuation (on commissions, director fees, and salary and wages) 2,672 2,147 ◼ Other employment related costs 4,273 3,746 ◼ Government grants received in connection with employment costs 1.3.4a – (1,410)
58,227 44,398 2.4.1 Accounting policy a. Short-term benefits Liabilities for employee benefits for wages, salaries and annual leave that are expected to be settled within 12 months of the reporting date represent present obligations resulting from employees’ services provided to the reporting date and are calculated at undiscounted amounts based on remuneration wage and salary rates that the Group expects to pay at the reporting date including related on-costs, such as workers compensation insurance and payroll tax. Non-accumulating non-monetary benefits, such as medical care, housing, cars and free or subsidised goods and services, are expensed based on the net marginal cost to the Group as the benefits are taken by the employees.
b. Other long-term benefits The Group’s obligation in respect of long-term employee benefits other than defined benefit plans, such as long service leave, is the amount of future benefit that employees have earned in return for their service in the current and prior periods plus related on-costs; that benefit is discounted to determine its present value, and the fair value of any related assets is deducted. The discount rate is the Reserve Bank of Australia’s cash rate at the report date that have maturity dates approximating the terms of the Company’s obligations. Any actuarial gains or losses are recognised in profit or loss in the period in which they arise.
P a g e | 30
THE AGENCY GROUP AUSTRALIA LTD ANNUAL REPORT AND CONTROLLED ENTITIES 30 June 2022 ABN 52 118 913 232
Notes to the consolidated financial statements for the year ended 30 June 2022
Note 2 Expenses (cont.) 2.4 Salaries and employment costs (cont.) c. Retirement benefit obligations: Defined contribution superannuation funds A defined contribution plan is a post-employment benefit plan under which an entity pays fixed contributions onto a separate entity and will have no legal or constructive obligation to pay further amounts. Obligations for contributions to defined contribution superannuation funds are recognised as an expense in the income statement as incurred.
d. Termination benefits When applicable, the Group recognises a liability and expense for termination benefits at the earlier of: (a) the date when the Group can no longer withdraw the offer for termination benefits; and (b) when the Group recognises costs for restructuring pursuant to AASB 137 Provisions, Contingent Liabilities and Contingent Assets and the costs include termination benefits. In either case, unless the number of employees affected is known, the obligation for termination benefits is measured based on the number of employees expected to be affected. Termination benefits that are expected to be settled wholly before 12 months after the annual reporting period in which the benefits are recognised are measured at the (undiscounted) amounts expected to be paid. All other termination benefits are accounted for on the same basis as other long-term employee benefits.
e. Equity-settled compensation The fair value of options granted is recognised as an employee expense with a corresponding increase in equity. The fair value is measured at grant date and spread over the period during which the employees become unconditionally entitled to the options. The fair value of the options granted is measured using the Black-Scholes pricing model, considering the terms and conditions upon which the options were granted. The amount recognised is adjusted to reflect the actual number of share options that vest except where forfeiture is only due to market conditions not being met.
2.5 Depreciation and amortisation Note 2022 2021 $’000 $’000 ◼ Depreciation – plant and equipment 6.1.1 607 595 ◼ Depreciation – right-of-use assets 6.2.4 1,589 1,523 ◼ Amortisation – intangible assets 6.3.2 3,244 3,348
5,440 5,466 2.5.1 Accounting policy a. Impairment of financial assets Refer to note 5.8.1d b. Impairment of non-financial assets Refer to note 6.5.1
P a g e | 31
ANNUAL REPORT THE AGENCY GROUP AUSTRALIA LTD 30 June 2022 AND CONTROLLED ENTITIES ABN 52 118 913 232
Notes to the consolidated financial statements for the year ended 30 June 2022
Note 3 Other Significant Accounting Policies related to items of profit and loss 3.1 Finance income and expenses Finance income comprises interest income on funds invested (including available-for-sale financial assets), gains on the disposal of available-for-sale financial assets and changes in the fair value of financial assets at fair value through profit or loss. Interest revenue is recognised on a time proportionate basis that considers the effective yield on the financial asset. Financial expenses comprise interest expense on borrowings calculated using the effective interest method, unwinding of discounts on provisions, changes in the fair value of financial assets at fair value through profit or loss and impairment losses recognised on financial assets. All borrowing costs are recognised in profit or loss using the effective interest method. Borrowing costs directly attributable to the acquisition, construction or production of assets that necessarily take a substantial period of time to prepare for their intended use or sale, are added to the cost of those assets, until such time as the assets are substantially ready for their intended use or sale. All other borrowing costs are recognised in income in the period in which they are incurred. Foreign currency gains and losses are reported on a net basis.
Note 4 Income tax Note 2022 2021 $’000 $’000 4.1 Income tax benefit Current tax – – Deferred tax (1,127) (1,894) (1,127) (1,894)
Deferred income tax expense included in income tax expense comprises: ◼ Increase in deferred tax assets (DTAs) 4.5 (301) (1,243) ◼ Decrease in deferred tax liabilities (DTLs) 4.6 (826) (651)
(1,127) (1,894) 4.2 Reconciliation of income tax expense to prima facie tax payable The prima facie tax benefit on profit or loss from ordinary activities before income tax is reconciled to the income tax expense as follows: Accounting profit / (loss) before tax 461 (3,750)
Prima facie tax on operating profit at 30% (2021 loss: 30%) 138 (1,125) Add / (Less) tax effect of: ◼ Non-deductible expenses (190) 796 ◼ Non-assessable income and gains (1) (16) ◼ Recognition of DTA on revenue losses, not previously recognised (1,045) (1,802) ◼ Other deductible expenses (29) (39) ◼ Impact of change in tax rate 4.3a – 295 ◼ Unrecognised income tax benefit in respect of current year losses – (3) and timing differences
Income tax benefit attributable to operating profit / (loss) (1,127) (1,894)
P a g e | 32
THE AGENCY GROUP AUSTRALIA LTD ANNUAL REPORT AND CONTROLLED ENTITIES 30 June 2022 ABN 52 118 913 232
Notes to the consolidated financial statements for the year ended 30 June 2022
Note 4 Income tax (cont.) 2022 2021 % % 4.3 The applicable weighted average effective tax rates attributable to operating profit are as follows: (244.47) 50.51 a. The tax rates used in the above reconciliations is the corporate tax rate of 30% payable by the Australian corporate entity on taxable profits under Australian tax law.
4.4 Balance of franking account at year end of the parent company $nil $nil
4.5 Deferred tax assets Note 2022 2021 $’000 $’000 Employee benefits 612 559 Accrued expenses 2,014 1,747 Provisions 274 177 AASB 16 Leases – Lease Liability 213 182 Other 162 309 3,275 2,974
Set-off deferred tax liabilities 4.6 (3,275) (2,974)
Net deferred tax assets – –
4.6 Deferred tax liabilities Intangible Asset – Rent Roll 3,380 4,331 Property, plant, and equipment (deprecation) 88 – Financial assets – investments (fair valuation) 37 – 3,505 4,331
Set-off deferred tax assets 4.5 (3,275) (2,974)
Net deferred tax liabilities 230 1,357
4.7 Tax losses and deductible temporary differences Unused tax losses and deductible temporary differences for which no DTA has been recognised, that may be utilised to offset tax liabilities: ◼ Revenue losses attributable to Australia 3,712 5,064
3,712 5,064
4.8 Potential deferred tax assets attributable to tax losses have not been brought to account at 30 June 2022 because the Directors do not believe it is appropriate to regard realisation of the deferred tax assets as probable at this point in time. These benefits will only be obtained if: i. the Group derives future assessable income of a nature and of an amount sufficient to enable the benefit from the deductions for the loss to be realised; ii. the Company continues to comply with conditions for deductibility imposed by law; and iii. no changes in tax legislation adversely affect the Group in realising the benefit from the deductions for the loss. Balances disclosed in the financial statements and the notes thereto, related to taxation, are based on the best estimates of the Directors. These estimates consider both the financial performance and position of the Company as they pertain to current income taxation legislation, and the Directors understanding thereof. No adjustment has been made for pending or future taxation legislation. The current income tax position represents that Directors’ best estimate, pending an assessment by tax authorities in relevant jurisdictions. The parent company has accumulated tax losses of $12,373K (2021: $16,880K) which may be available for offset against future taxable profits of the parent company in which the losses arose. The recoupment of these losses is subject to assessment by the Australian Taxation Office.
P a g e | 33
ANNUAL REPORT THE AGENCY GROUP AUSTRALIA LTD 30 June 2022 AND CONTROLLED ENTITIES ABN 52 118 913 232
Notes to the consolidated financial statements for the year ended 30 June 2022
Note 4 Income tax (cont.) Note
4.9 Accounting policy The income tax expense or benefit for the period is the tax payable on the current period’s taxable income based on the applicable income tax rate for each jurisdiction adjusted by changes in deferred tax assets and liabilities attributable to temporary difference and to unused tax losses. The current income tax charge is calculated based on the Australian tax laws enacted or substantively enacted at the end of the reporting period being where the Group and its associates operate and generate taxable income. Management periodically evaluates positions taken in tax returns with respect to situations in which applicable tax regulation is subject to interpretation. It establishes provisions where appropriate based on amounts expected to be paid to the tax authorities. Current tax assets and liabilities for the current and prior periods are measured at the amount expected to be recovered from or paid to the taxation authorities. The tax rates and tax laws used to compute the amount are those that are enacted or substantively enacted by the balance date, in Australia. Deferred income tax is provided on all temporary differences at the balance date between the tax bases of assets and liabilities and their carrying amounts for financial reporting purposes. Deferred income tax liabilities (DTL) are recognised for all taxable temporary differences except: ◼ when the DTL arises from the initial recognition of goodwill or of an asset or liability in a transaction that is not a business combination and that, at the time of the transaction, affects neither the accounting profit nor taxable profit or loss; or ◼ when the taxable temporary difference is associated with investments in subsidiaries, associates or interests in joint ventures, and the timing of the reversal of the temporary difference can be controlled and it is probable that the temporary difference will not reverse in the foreseeable future. Deferred income tax assets (DTA) are recognised for all deductible temporary differences, carry-forward of unused tax assets and unused tax losses, to the extent that it is probable that taxable profit will be available against which the deductible temporary differences and the carry-forward of unused tax credits and unused tax losses can be utilised, except: ◼ when the DTA relating to the deductible temporary difference arises from the initial recognition of an asset or liability in a transaction that is not a business combination and, at the time of the transaction, affects neither the accounting profit nor taxable profit or loss; or ◼ when the deductible temporary difference is associated with investments in subsidiaries, associates or interests in joint ventures, in which case a DTA is only recognised to the extent that it is probable that the temporary difference will reverse in the foreseeable future and taxable profit will be available against which the temporary difference can be utilised. The carrying amount of DTA is reviewed at each balance date and reduced to the extent that it is no longer probable that sufficient taxable profit will be available to allow all or part of the DTA to be utilised. Unrecognised DTA are reassessed at each balance date and are recognised to the extent that it has become probable that future taxable profit will allow the deferred tax asset to be recovered. DTAs and DTLs are measured at the tax rates that are expected to apply to the year when the asset is realised or the liability is settled, based on tax rates (and tax laws) that have been enacted or substantively enacted at the balance date. Income taxes relating to items recognised directly in equity are recognised in equity and not in profit or loss. DTAs and DTLs are offset only if a legally enforceable right exists to set off current tax assets against current tax liabilities and the DTAs and DTLs relate to the same taxable entity and the same taxation authority.
4.9.1 Tax consolidation The Agency Group Australia Ltd and its wholly-owned Australian subsidiaries have formed an income tax consolidated group (the Tax Group) under the tax consolidation legislation. Each entity in the Tax Group recognises its own current and deferred tax liabilities, except for any DTLs resulting from unused tax losses and tax credits, which are immediately assumed by the parent entity. The Group notified the Australian Tax Office that it had formed a Tax Group to apply from 1 July 2019. The Tax Group has entered a tax sharing agreement whereby each company in the Tax Group contributes to the income tax payable in proportion to their contribution to the net profit before tax of the Tax Group.
P a g e | 34
THE AGENCY GROUP AUSTRALIA LTD ANNUAL REPORT AND CONTROLLED ENTITIES 30 June 2022 ABN 52 118 913 232
Notes to the consolidated financial statements for the year ended 30 June 2022
Note 5 Financial assets and financial liabilities
5.1 Cash and cash equivalents 2022 2021 $’000 $’000 Cash at bank 8,216 5,096
8,216 5,096
5.1.1 The Group’s exposure to interest rate risk and a sensitivity analysis for financial assets and liabilities are disclosed in note 8 Financial risk management.
2022 2021 5.1.2 Cash Flow Information $’000 $’000 a. Reconciliation of cash flow from operations to loss after income tax Profit / (loss) after income tax 1,588 (1,856) ◼ Cash flows excluded from loss attributable to operating activities – – ◼ Non-cash flows in loss from ordinary activities: Depreciation and amortisation 5,440 5,466 Impairment (recovery) / expense (400) 400 Income tax benefit (1,127) (1,894) Non-cash interest adjustments 519 541 Embedded derivative non-cash financing (gain) / costs (1,140) 2,244 Share-based payments expense 675 216 Profit or loss on disposal of assets (5) – Fair value adjustments through profit and loss (123) – ◼ Changes in assets and liabilities, net of the effects of purchase and disposal of subsidiaries: (Increase) in receivables (2,905) (2,785) (Increase)/decrease in financial assets (11) 1,157 Increase in trade and other payables 3,737 932 Increase in provisions 352 222
Cash flow from operations – 6,600 4,643 – –
b. Reconciliation of liabilities arising from financing activities Non-cash changes Other Embedded Converted 2020 Cash flows Additions Changes Derivative to equity 2021 $’000 $’000 $’000 $’000 $’000 $’000 $’000
Short-term borrowings 13,843 (7,843) – (6,000) – – – Long-term borrowings – 5,000 – 6,000 2,496 (3,613) 9,883 and financial liabilities Leases 5,875 (1,916) 1,695 191 – – 5,845 Total liabilities from financing activities 19,718 (4,759) 1,695 191 2,496 (3,613) 15,728 –
P a g e | 35
ANNUAL REPORT THE AGENCY GROUP AUSTRALIA LTD 30 June 2022 AND CONTROLLED ENTITIES ABN 52 118 913 232
Notes to the consolidated financial statements for the year ended 30 June 2022
Note 5 Financial assets and financial liabilities (cont.)
5.1 Cash and cash equivalents (cont.) 5.1.2 Cash Flow Information (cont.) Non-cash changes Other Embedded Converted 2021 Cash flows Additions Changes Derivative to equity 2022 $’000 $’000 $’000 $’000 $’000 $’000 $’000
Short-term borrowings – – – 7,039 1,982 – 9,021 Long-term borrowings 9,883 – – (5,895) (3,988) – – and financial liabilities Leases 5,845 (1,956) 238 264 – – 4,391 Total liabilities from financing activities 15,728 (1,956) 238 1,408 (2,006) – 13,412 – –
c. Credit and loan standby arrangement with banks Refer note 5.6.5 Financing facilities available.
d. Non-cash investing and financing activities 2022 ◼ Reclassification of borrowings and financial liabilities to current. Subsequent to balance date, the terms of both the borrowing and financial liabilities were renegotiated, as disclosed in note 14.2 and 14.3. 2021 During the prior year, non-cash investing and financing activities consisted of: ◼ Issue of 115,621,485 shares upon the conversion of $3,612,768 of convertible notes as described in notes 5.7.4 and 7.1.1. ◼ Reclassification of borrowings to non-current upon renegotiation of terms with Macquarie Bank Limited. ◼ The recognition of an embedded derivative in connection with convertible notes as described in notes 5.7.3 consisting of interest of $623,557, fair value adjustments of $1,986,988, and transaction costs of ($115,105).
5.1.3 Accounting policy For Statement of Cash Flow presentation purposes, cash and cash equivalents includes cash on hand, deposits held at call with financial institutions, other short-term, highly liquid instruments with original maturities of three months or less that are readily convertible to known amounts of cash and which are subject to an insignificant risk of changes in value, and bank overdrafts. Bank overdrafts are shown within borrowings in current liabilities on the Statement of Financial Position.
P a g e | 36
THE AGENCY GROUP AUSTRALIA LTD ANNUAL REPORT AND CONTROLLED ENTITIES 30 June 2022 ABN 52 118 913 232
Notes to the consolidated financial statements for the year ended 30 June 2022
Note 5 Financial assets and financial liabilities (cont.)
5.2 Trade and other receivables 2022 2021 $’000 $’000 5.2.1 Current Trade debtors 5.2.4 7,957 6,673 Recoverable commissions and wages 1,373 1,125 Other receivables 1,665 856 Provision for non-recovery of trade debtor and commissions / wages (237) (300) Loan to KMP 16b 345 –
11,103 8,354 5.2.2 Non-current Trade debtors 145 163
145 163
5.2.3 The Group’s exposure to credit rate risk is disclosed in note 8 Financial risk management. 5.2.4 The average credit period on rendering of services ranges from current to 30 days. Interest is not charged. No allowance has been made for estimated irrecoverable trade receivable amounts arising from past sale of goods and rendering of services, determined by reference to past default experience. Amounts are considered as past due when the debt has not been settled, within the terms and conditions agreed between the Group and the customer or counter party to the transaction.
5.2.5 Accounting policy Trade receivables are recognised initially at fair value and subsequently measured at amortised cost, less provision for doubtful debts. Trade receivables are due for settlement within no more than 30 days. Marketing allowances and upfront commissions paid to employees and agents are recovered against future sales commissions received by the employee or agent.
a. Determining the stage for impairment At each reporting date, the Group assesses whether there has been a significant increase in credit risk for exposures since initial recognition by comparing the risk of default occurring over the remaining expected life from the reporting date and the date of initial recognition. The Group considers reasonable and supportable information that is relevant and available without undue cost or effort for this purpose. This includes quantitative and qualitative information and also, forward-looking analysis. An exposure will migrate through the expected credit loss (ECL) stages as asset quality deteriorates. If, in a subsequent period, asset quality improves and also reverses any previously assessed significant increase in credit risk since origination, then the provision for doubtful debts reverts from lifetime ECL to 12-months ECL. Exposures that have not deteriorated significantly since origination are considered to have a low credit risk. The provision for doubtful debts for these financial assets is based on a 12-months ECL. When an asset is uncollectible, it is written off against the related provision. Such assets are written off after all the necessary procedures have been completed and the amount of the loss has been determined. Subsequent recoveries of amounts previously written off reduce the amount of the expense in the Consolidated Statement of Profit or Loss and Other Comprehensive Income. The Group assesses whether the credit risk on an exposure has increased significantly on an individual or collective basis. For the purposes of a collective evaluation of impairment, financial instruments are accompanied on the basis of shared credit risk characteristics, taking into account instrument type, credit risk ratings, date of initial recognition, remaining term to maturity, industry, geographical location of the borrower and other relevant factors
P a g e | 37
ANNUAL REPORT THE AGENCY GROUP AUSTRALIA LTD 30 June 2022 AND CONTROLLED ENTITIES ABN 52 118 913 232
Notes to the consolidated financial statements for the year ended 30 June 2022
Note 5 Financial assets and financial liabilities (cont.)
5.3 Financial assets 2022 2021 $’000 $’000 5.3.1 Non-current Bank guarantees and restricted cash 624 613 Financial assets at FVPL 5.3.2 212 –
836 613 5.3.2 Accounting policy a. Recognition and Measurement The Group classifies the equity investments for which the entity has not elected to recognise fair value gains and losses through OCI as financial assets at fair value through profit or loss (FVPL). Refer to note 5.8.1c
5.4 Other assets Note 2022 2021 $’000 $’000 5.4.1 Current Prepayments 490 306 Other deposits 5.4.2 7 418 Less: provision for impairment 5.4.3 – (400)
497 324
5.4.2 Other deposits at 30 June 2021 relate to an advance payment of $400,000 made to the Federal Court regarding the Magnolia case and other amounts of $17,690. This value was impaired for the same period. 5.4.3 During the year, the $400,000 provision for impairment was reversed following the favourable decision of the Federal Court (announced 23 November 2021), costs were awarded to The Agency and the $400,000 was returned to the Company.
5.5 Trade and other payables 2022 2021 $’000 $’000 5.5.1 Current Trade payables 5,143 2,552 Employees’ remuneration – commissions payable 4,677 3,706 Payroll tax 487 354 Superannuation – employees 174 393 Sundry creditors and accrued expenses 2,927 2,512 GST and PAYG payable 1,510 1,677
14,918 11,194
5.5.2 Trade payables are unsecured, non-interest bearing and are normally settled on 30-day terms. Other payables are unsecured non-trade payables, are non-interest bearing and have an average term of 1 month.
5.5.3 Accounting policy a. Trade and other payables These amounts represent liabilities for goods and services provided to the Group prior to the end of financial year which are unpaid. The amounts are unsecured and are usually paid within 30 days of recognition. Trade and other payables are presented as current liabilities unless payment is not due within 12 months.
P a g e | 38
THE AGENCY GROUP AUSTRALIA LTD ANNUAL REPORT AND CONTROLLED ENTITIES 30 June 2022 ABN 52 118 913 232
Notes to the consolidated financial statements for the year ended 30 June 2022
Note 5 Financial assets and financial liabilities (cont.)
5.6 Borrowings Note 2022 2021 $’000 $’000 5.6.1 Current Bank loans 5.6.3 5,000 –
5,000 – 5.6.2 Non-current Bank loans 5.6.3 – 5,000
– 5,000
5.6.3 On 4 August 2021 the Company executed an amendment deed to its loan agreement with Macquarie Bank Limited (MBL). Pursuant to the terms of the amendment deed, the revised terms of the loan include: ◼ Loan amount $5,000,000 ◼ Interest rate Base Rate (BBSW) + margin of 3.75%. The Base Rate (determined monthly) has ranged between 0.10% to 0.85% during the period ◼ Repayment date On or before 4 January 2023 ◼ Covenants The Company has covenanted to MBL that it will maintain an EBITDA interest cover ratio of at least 3 times. The definition of interest expense does not include financial indebtedness owed by the Company to Peters Investments Pty Ltd, in accordance with the convertible notes issued on 15 May 2020 and 4 January 2021 respectively. ◼ Termination/Default It is an event of default under the loan agreement if the total number of sales agents employed by the Company’s wholly owned subsidiary, Top Level Real Estate Pty Ltd, is less than, or falls to less than 59. The Loan Agreement otherwise contains default and termination provisions considered standard for a bank facility of this nature. On 25 July 2022, the Company announced that it has executed an amendment deed to its loan agreement with MBL. The revised terms of the loan are detailed in note 14.2.
5.6.4 Assets pledged as security Security is held over all the Group companies.
5.6.5 Financing facilities available At balance date, the following Total facilities Facilities used Facilities unused financing facilities had been 2022 2021 2022 2021 2022 2021 negotiated and were available: $’000 $’000 $’000 $’000 $’000 $’000 Bank and other loans 5,000 5,000 (5,000) (5,000) – –
Total facilities at balance date 5,000 5,000 (5,000) (5,000) – –
5.6.6 Accounting policy a. Borrowings Borrowings are initially recognised at fair value, net of transaction costs incurred. Borrowings are subsequently measured at amortised cost. Any difference between the proceeds (net of transaction costs) and the redemption amount is recognised in profit or loss over the period of the borrowings using the effective interest method. Fees paid on the establishment of loan facilities are recognised as transaction costs of the loan to the extent that it is probable that some or all of the facility will be drawn down. In this case, the fee is deferred until the draw down occurs. To the extent there is no evidence that it is probable that some or all of the facility will be drawn down, the fee is capitalised as a prepayment for liquidity services and amortised over the period of the facility to which it relates. Borrowings are removed from the statement of financial position when the obligation specified in the contract is discharged, cancelled, or expired. The difference between the carrying amount of a financial liability that has been extinguished or transferred to another party and the consideration paid, including any non-cash assets transferred or liabilities assumed, is recognised in profit or loss as other income or finance costs. Borrowings are classified as current liabilities unless the Group has an unconditional right to defer settlement of the liability for at least 12 months after the reporting period.
P a g e | 39
ANNUAL REPORT THE AGENCY GROUP AUSTRALIA LTD 30 June 2022 AND CONTROLLED ENTITIES ABN 52 118 913 232
Notes to the consolidated financial statements for the year ended 30 June 2022
Note 5 Financial assets and financial liabilities (cont.)
5.7 Financial liabilities Note 2022 2021 $’000 $’000 5.7.1 Current Convertible note: 5.7.3,5.7.4 ◼ Debt component 2,039 – ◼ Derivative financial liability conversion option 1,982 –
4,021 – 5.7.2 Non-current Convertible note: 5.7.3,5.7.4 ◼ Debt component – 895 ◼ Derivative financial liability conversion option – 3,988
– 4,883 5.7.3 Reconciliation of convertible notes Opening balance: ◼ from Borrowings – 1,000 ◼ Debt component 895 – ◼ Derivative financial liability conversion option 3,988 – Proceeds on issue of convertible notes – 5,000
4,883 6,000
◼ Fair value of derivative liabilities – 4,988 ◼ Host debt liability – 897 ◼ Convertible loan notes converted to equity – (3,613) ◼ Interest charged 1,144 624 ◼ Fair value movement (2,006) 1,987
Carrying value of liabilities at reporting date 4,021 4,883
5.7.4 On 5 January 2021, following shareholder approval, the Company issued 5,000,000 convertible notes to Peters Investments Pty Ltd to raise $5,000,000. In addition, the terms of the 1,000,000 convertible notes issued to Peters Investments in May 2020 were amended to be consistent with those of the 5,000,000 convertible notes: ◼ Interest rate higher of 8% per annum and the interest rate on the Macquarie Bank Limited (MBL) loan ◼ Facilitation fee 3% fee equalling $150,000 which is capitalised and added to the face value of the note. ◼ Security Second security ranking behind MBL. ◼ Options 12,000,000 Options exercisable at the $0.027 on or before 31 March 2023. These options were exercised on 28 January 2021. ◼ Term/Maturity Date Unless converted to shares the notes will be repaid in cash on the earlier of 31 March 2023 or when all amounts owing by the Company to MBL have been repaid. ◼ Conversion At the noteholders election the notes can be converted into shares in The Agency at the lower of $0.027 per share and the issue price of shares offered under any subsequent capital raising completed by the Company to raise over $1,000,000 on or before maturity date. ◼ Other Conditions The Noteholder will have the first right of refusal to replace the MBL loan on commercial terms and conditions to be reasonably agreed between the Noteholder and The Agency. On 28 January 2021, Peter Investments converted $3,612,768 of debt and interest into 115,621,485 shares. Subsequent to balance date the Company executed an amendment deed for the convertible notes. The revised terms are detailed in note 14.3, and are subject to shareholder approval.
P a g e | 40
THE AGENCY GROUP AUSTRALIA LTD ANNUAL REPORT AND CONTROLLED ENTITIES 30 June 2022 ABN 52 118 913 232
Notes to the consolidated financial statements for the year ended 30 June 2022
Note 5 Financial assets and financial liabilities (cont.)
5.7 Financial liabilities (cont.) 5.7.5 Accounting policies and Critical Estimates – Convertible notes a. Debt component The conversion feature of convertible notes (notes) is required to be separated from the notes and is accounted for separately as a derivative financial liability. As a result, the notes are initially recognised at a discounted amount. The discount is amortised as interest expense using the effective interest method over the terms of the notes.
b. Embedded derivative – Conversion feature The conversion feature in the notes represents the embedded derivative financial instrument in the host debt contract. The conversion feature represents the Group’s obligation to issue Company shares at a fixed price should noteholders exercise their conversion option. The embedded derivatives are carried in the Statement of Financial Position at their estimated fair value taking market participant assumptions into consideration, with any changes in fair value recognised in the Statement of Profit or Loss and Other Comprehensive Income. These values were calculated using the Black-Scholes option pricing model, applying the following inputs: Grant Date Balance Date Face Value: $5,150,000 $3,630,079 Share price: $0.035 $0.037 Conversion price: $0.027 $0.027 Expiry date 31 March 2023 31 March 2023 Expected share price volatility: 100.00 92.00 Risk-free interest rate: 1.90% 3.20% Value per conversion right $0.0219 $0.0160
c. Settlement of Convertible Notes Where notes are settled by issue of shares, the related financial liabilities are derecognised at their carrying value with the corresponding increase to share capital. Any costs incurred are recognised in profit or loss. Where notes are settled by payment of cash, the related financial liabilities are derecognised at their carrying value and the difference between total cash consideration paid and the carrying value of the financial liabilities derecognised is recognised in profit or loss.
d. Capitalised transaction costs The Company incurred transaction costs upon the issuance of the notes. Transaction costs relating to the notes have been allocated between the debt component and the conversion derivatives using the relating proportions of these on initial measurement of the instruments. Costs attributed to the debt component are amortised to finance expense over the term of the notes using the effective interest method. Costs allocated to the conversion derivatives are immediately recognised in the Statement of Profit or Loss and Other Comprehensive Income.
P a g e | 41
ANNUAL REPORT THE AGENCY GROUP AUSTRALIA LTD 30 June 2022 AND CONTROLLED ENTITIES ABN 52 118 913 232
Notes to the consolidated financial statements for the year ended 30 June 2022
Note 5 Financial assets and financial liabilities (cont.)
5.8 Other Significant Accounting Policies related to Financial Assets and Liabilities 5.8.1 Investments and other financial assets a. Classification The Group classifies its financial assets in the following measurement categories: ◼ those to be measured subsequently at fair value (either through OCI or through profit or loss), and ◼ those to be measured at amortised cost. The classification depends on the entity’s business model for managing the financial assets and the contractual terms of the cash flows. For assets measured at fair value, gains and losses will either be recorded in profit or loss or OCI. For investments in equity instruments that are not held for trading, this will depend on whether the group has made an irrevocable election at the time of initial recognition to account for the equity investment at fair value through other comprehensive income (FVOCI). The Group reclassifies debt investments when and only when its business model for managing those assets changes.
b. Recognition and derecognition Regular way purchases and sales of financial assets are recognised on trade-date, the date on which the Group commits to purchase or sell the asset. Financial assets are derecognised when the rights to receive cash flows from the financial assets have expired or have been transferred and the Group has transferred substantially all the risks and rewards of ownership.
c. Measurement At initial recognition, the Group measures a financial asset at its fair value plus, in the case of a financial asset not at fair value through profit or loss (FVPL), transaction costs that are directly attributable to the acquisition of the financial asset. Transaction costs of financial assets carried at FVPL are expensed in profit or loss. Financial assets with embedded derivatives are considered in their entirety when determining whether their cash flows are solely payment of principal and interest.
i. Debt instruments Subsequent measurement of debt instruments depends on the Group’s business model for managing the asset and the cash flow characteristics of the asset. There are three measurement categories into which the Group classifies its debt instruments: ◼ Amortised cost: Assets that are held for collection of contractual cash flows where those cash flows represent solely payments of principal and interest are measured at amortised cost. Interest income from these financial assets is included in finance income using the effective interest rate method. Any gain or loss arising on derecognition is recognised directly in profit or loss and presented in other gains/(losses). Impairment losses are presented as separate line item in the statement of profit or loss. ◼ FVOCI: Assets held for collection of contractual cash flows and for selling the financial assets, where the assets’ cash flows represent solely payments of principal and interest, are measured at FVOCI. Movements in carrying amounts are taken through OCI, except for the recognition of impairment gains or losses, interest income and foreign exchange gains and losses which are recognised in profit or loss. When a financial asset is derecognised, the cumulative gain or loss previously recognised in OCI is reclassified from equity to profit or loss and recognised in other gains/(losses). Interest income from these financial assets is included in finance income using the effective interest rate method. Foreign exchange gains and losses are presented in other gains/(losses) and impairment expenses are presented separately in the statement of profit or loss. ◼ FVPL: Assets that do not meet the criteria for amortised cost or FVOCI are measured at FVPL. A gain or loss on a debt investment that is subsequently measured at FVPL is recognised in profit or loss and presented net within other gains/(losses) in the period in which it arises.
P a g e | 42
THE AGENCY GROUP AUSTRALIA LTD ANNUAL REPORT AND CONTROLLED ENTITIES 30 June 2022 ABN 52 118 913 232
Notes to the consolidated financial statements for the year ended 30 June 2022
Note 5 Financial assets and financial liabilities (cont.)
5.8 Other Significant Accounting Policies related to Financial Assets and Liabilities (cont.) ii. Equity instruments The Group subsequently measures all equity investments at fair value. Where the group’s management has elected to present fair value gains and losses on equity investments in OCI, there is no subsequent reclassification of fair value gains and losses to profit or loss following the derecognition of the investment. Dividends from such investments continue to be recognised in profit or loss as other income when the group’s right to receive payments is established. Changes in the fair value of financial assets at FVPL are recognised in other gains/(losses) in the statement of profit or loss as applicable. Impairment losses (and reversal of impairment losses) on equity investments measured at FVOCI are not reported separately from other changes in fair value.
d. Impairment The Group assesses on a forward-looking basis, the expected credit losses associated with its debt instruments carried at amortised cost and FVOCI. The impairment methodology applied depends on whether there has been a significant increase in credit risk. For trade receivables, the Group applies the simplified approach permitted by AASB 9, which requires expected lifetime losses to be recognised from initial recognition of the receivables.
Note 6 Non-financial assets and financial liabilities
6.1 Property, plant, and equipment 2022 2021 $’000 $’000 Plant and equipment – at cost 1,525 1,253 Accumulated depreciation (893) (725)
632 528
Leasehold improvements – at cost 4,141 3,448 Accumulated amortisation (2,837) (2,398)
1,304 1,050
Total plant and equipment 1,936 1,578
Plant and Leasehold Equipment improvements Total 6.1.1 Movements in Carrying Amounts 5 $’000 $’000 $’000 Carrying amount at 1 July 2020 573 1,467 2,040 Additions 96 41 137 Disposals / write-offs (4) – (4) Depreciation expense (137) (458) (595)
Carrying amount at 30 June 2021 528 1,050 1,578 – – –
Carrying amount at 1 July 2021 528 1,050 1,578 Additions 271 694 965 Disposals / write-offs – – – Depreciation expense (167) (440) (607)
Carrying amount at 30 June 2022 632 1,304 1,936 – – –
P a g e | 43
ANNUAL REPORT THE AGENCY GROUP AUSTRALIA LTD 30 June 2022 AND CONTROLLED ENTITIES ABN 52 118 913 232
Notes to the consolidated financial statements for the year ended 30 June 2022
Note 6 Non-financial assets and financial liabilities (cont.)
6.1 Property, plant, and equipment (cont.) 6.1.2 Accounting policy a. Recognition and measurement Items of plant and equipment are measured on the cost basis and carried at cost less accumulated depreciation (see below) and impairment losses (see accounting policy 6.5.1 Impairment of non-financial assets). Cost includes expenditure that is directly attributable to the acquisition of the asset. The cost of self-constructed assets includes the cost of materials and direct labour, any other costs directly attributable to bringing the asset to a working condition for its intended use, and the costs of dismantling and removing the items and restoring the site on which they are located, and an appropriate proportion of production overheads. Cost includes the cost of replacing parts that are eligible for capitalisation when the cost of replacing the parts is incurred. Similarly, when each major inspection is performed, its cost is recognised in the carrying amount of the plant and equipment as a replacement only if it is eligible for capitalisation. Where considered material, the carrying amount of property, plant, and equipment is reviewed annually by Directors to ensure it is not in excess of the recoverable amount from these assets. The recoverable amount is assessed on the basis of the expected net cash flows that will be received from the asset’s employment and subsequent disposal. The expected net cash flows have not been discounted to their present values in determining recoverable amounts. Where parts of an item of property, plant, and equipment have different useful lives, they are accounted for as separate items of plant and equipment.
b. Subsequent costs The cost of replacing part of an item of plant and equipment is recognised in the carrying amount of the item if it is probable that the future economic benefits embodied within the part will flow to the Group and its cost can be measured reliably. Any costs of the day-to-day servicing of plant and equipment are recognised in the income statement as an expense as incurred.
c. Depreciation The depreciable amount of all fixed assets including building and capitalised lease assets, but excluding freehold land, is depreciated on either a straight-line basis or diminishing balance basis, whichever is considered most appropriate, over their useful lives to the Group commencing from the time the asset is held ready for use. Leasehold improvements are amortised over the remaining term of the lease. Depreciation rates and methods are reviewed annually for appropriateness. The depreciation rates used for the current and comparative period are: Class 2022 2021 % % ◼ Leasehold Improvements Over term of lease Over term of lease ◼ Plant and equipment: Office furniture and fittings 10 10 Office equipment 25 25 Motor vehicle 25 25 The carrying amount of plant and equipment is reviewed annually by Directors to ensure it is not in excess of the recoverable amount from these assets. The recoverable amount is assessed on the basis of the expected net cash flows which will be received from the assets’ employment and subsequent disposal. The expected net cash flows have not been discounted to their present values in determining recoverable amounts.
d. Derecognition and disposal An item of property, plant and equipment is derecognised upon disposal or when no further future economic benefits are expected from its use or disposal. The gain or loss on disposal of an item of property, plant and equipment is determined by comparing the proceeds from disposal with the carrying amount of the property, plant and equipment and is recognised net within other income/other expenses in profit or loss. When revalued assets are sold, any related amount included in the revaluation reserve is transferred to retained earnings.
P a g e | 44
THE AGENCY GROUP AUSTRALIA LTD ANNUAL REPORT AND CONTROLLED ENTITIES 30 June 2022 ABN 52 118 913 232
Notes to the consolidated financial statements for the year ended 30 June 2022
Note 6 Non-financial assets and financial liabilities (cont.)
6.2 Leases 2022 2021 $’000 $’000 6.2.1 Right of use assets Properties 2,684 3,704 Printing equipment 921 1,190
3,605 4,894 6.2.2 Lease liabilities Current 1,836 1,828 Non-current 2,555 4,017
4,391 5,845
6.2.3 Additions to the right-of-use assets 238 3,125
6.2.4 Amounts recognised in the statement of profit or loss: ◼ Depreciation charge of right-of-use assets: Properties 269 1,244 Printing equipment 1,320 279
1,589 1,523 ◼ Interest expense (included in finance cost) 264 218
6.2.5 Total cash outflow for leases 1,956 1,916
6.2.6 Accounting policy a. Recognition and measurement Leases are recognised as a right-of-use asset and a corresponding liability at the date at which the leased asset is available for use by the Group.
i. Right of Use Asset The Group recognises a right of use asset at the commencement date of the lease. The right of use asset is initially measured at cost. The cost of right of use assets includes the amount of lease liabilities recognised, adjusted for any lease payments made at or before the commencement date, plus initial direct costs incurred and an estimate of costs to dismantle, remove or restore the leased asset, less any lease incentives received. Right-of-use assets are measured at cost comprising the following: ◼ the amount of the initial measurement of lease liability ◼ any lease payments made at or before the commencement date less any lease incentives received ◼ any initial direct costs, and ◼ restoration costs. Subsequent to initial measurement, the right of use asset is depreciated on a straight-line basis over the shorter of the lease term and the estimated useful life as follows: ◼ Properties 36 – 60 months ◼ Printing equipment 60 months Right of use assets are subject to impairment and are adjusted for any remeasurement of lease liabilities.
P a g e | 45
ANNUAL REPORT THE AGENCY GROUP AUSTRALIA LTD 30 June 2022 AND CONTROLLED ENTITIES ABN 52 118 913 232
Notes to the consolidated financial statements for the year ended 30 June 2022
Note 6 Non-financial assets and financial liabilities (cont.)
6.2 Leases (cont.) ii. Lease liabilities At the commencement date of the lease, the Group recognises lease liabilities at the present value of lease payment to be made over the lease term. The lease payments include fixed payments (including in substance fixed payments) less any lease incentives receivable, variable lease payments that depend on an index or a rate, and amounts expected to be paid under residual value guarantees. The lease payments also include the exercise price of a purchase option reasonably certain to be exercised by the Group and payments of penalties for terminating a lease, if the assessment of lease term reflects the Group exercising the option to terminate. The variable lease payments that do not depend on an index or a rate are recognised as expense in the period on which the event or condition that triggers the payments occurs. The present value of lease payments is discounted using the interest rate implicit in the lease or, if the rate cannot be readily determined, the Group’s incremental borrowing rate. The lease liability is measured at amortised cost using the effective interest method. After the commencement date, the amount of lease liabilities is increased to reflect the accretion of interest and reduced for the lease payments made. The amount of lease liability is remeasured when there is a change in future lease payments arising from a change in an index or rate, if there is a change in the Group’s estimate of the amount expected to be payable under a residual value guarantee, or if the Group changes its assessment of whether it will exercise a purchase, extension, or termination option. When the lease liability is remeasured, a corresponding adjustment is made to the carrying amount of the right of use asset, or is recognised in profit or loss if the carrying amount of the right of use asset has been reduced to zero. The Group has elected not to recognise right of use assets and lease liabilities for short term leases that have a lease term of 12 months or less and do not contain a purchase option, and leases of low value assets. The Group recognises the lease payments associated with these leases as an expense on a straight-line basis over the lease term.
b. Extension and termination options Extension options are included in the property leases of the Group. 6.2.7 Critical judgements in determining the lease term In determining the lease term, management considers all facts and circumstances that create an economic incentive to exercise an extension option, or not exercise a termination option. Extension options (or periods after termination options) are only included in the lease term if the lease is reasonably certain to be extended (or not terminated). For leases of properties and printing equipment, the following factors are normally the most relevant: ◼ If there are significant penalties to terminate (or not extend), the Group is typically reasonably certain to extend (or not terminate). ◼ If any leasehold improvements are expected to have a significant remaining value, the Group is typically reasonably certain to extend (or not terminate). ◼ Otherwise, the Group considers other factors including historical lease durations and the costs and business disruption required to replace the leased asset. The lease term is reassessed if an option is actually exercised (or not exercised) or the Group becomes obliged to exercise (or not exercise) it. The assessment of reasonable certainty is only revised if a significant event or a significant change in circumstances occurs, which affects this assessment, and that is within the control of the lessee.
P a g e | 46
THE AGENCY GROUP AUSTRALIA LTD ANNUAL REPORT AND CONTROLLED ENTITIES 30 June 2022 ABN 52 118 913 232
Notes to the consolidated financial statements for the year ended 30 June 2022
Note 6 Non-financial assets and financial liabilities (cont.)
6.3 Intangible assets Note 2022 2021 $’000 $’000
Goodwill 6.3.3 10,704 10,704
10,704 10,704
Rent Roll and trail book 6.3.5a 21,135 21,135 Accumulated amortisation (11,022) (7,852)
10,113 13,283
Others 611 292 Accumulated amortisation and impairment (113) (39)
498 253
Total intangibles 21,315 24,240
6.3.1 As disclosed in note 1.2.1, in 2021 the Company sold its West Coast rent roll business, resulting in the disposal of goodwill of $1,069,001 and rent roll asset of $1,843,907.
6.3.2 Movements in Carrying Amounts Note Goodwill Rent Roll Other Total $’000 $’000 $’000 $’000 Carrying amount at 1 July 2020 11,773 18,418 186 30,377 Additions – – 104 104 Disposals 1.2.1 (1,069) (1,824) – (2,893) Amortisation expense – (3,311) (37) (3,348)
Carrying amount at 30 June 2021 10,704 13,283 253 24,240 – – – –
Carrying amount at 1 July 2021 10,704 13,283 253 24,240 Additions – – 319 319 Disposals – – – – Amortisation expense – (3,170) (74) (3,244)
Carrying amount at 30 June 2022 10,704 10,113 498 21,315 – – – –
P a g e | 47
ANNUAL REPORT THE AGENCY GROUP AUSTRALIA LTD 30 June 2022 AND CONTROLLED ENTITIES ABN 52 118 913 232
Notes to the consolidated financial statements for the year ended 30 June 2022
Note 6 Non-financial assets and financial liabilities (cont.)
6.3 Intangible assets (cont.) 6.3.3 Allocation of goodwill to cash-generating units (CGU) Goodwill has been allocated for impairment testing purposes to the CGU. Before recognition of impairment losses, the carrying amount of goodwill was allocated to CGU as follows. 2022 2021 $’000 $’000 ◼ Top Level Real Estate – Residential sales 10,658 10,658 ◼ Settlements 46 46
Carrying amount as at 30 June 10,704 10,704 – – The recoverable amount of the Group’s Top Level Real Estate CGU has been determined based on a value in use calculation which uses cash flow projections based on financial budgets approved by Directors utilising the following key assumptions: ◼ Revenue has been extrapolated at a growth rate of 5.00% from the 2-year budget, with nil% growth rate applied from year 3; ◼ Discount rate is based upon a weighted average cost of capital of 15%. The Directors believe that any reasonably possible further change in the key assumptions on which recoverable amount is based would not cause Top Level Real Estate CGU carrying amount to exceed its recoverable amount. 6.3.4 Accounting policy a. Intangible assets acquired separately Intangible assets acquired separately are recorded at cost less accumulated amortisation and impairment. Amortisation is charged on a straight-line basis over their estimated useful lives. The estimated useful life and amortisation method is reviewed at the end of each annual reporting period, with any changes in these accounting estimates being accounted for on a prospective basis.
b. Intangible assets acquired in a business combination Intangible assets acquired as part of a business combination, other than goodwill, are initially measured at their fair value at the date of the acquisition. Intangible assets acquired separately are initially recognised at cost. Indefinite life intangible assets are not amortised and are subsequently measured at cost less any impairment. Finite life intangible assets are subsequently measured at cost less amortisation and any impairment. The gains or losses recognised in profit or loss arising from derecognition of intangible assets are measured as the difference between net disposal proceeds and the carrying amount of the intangible asset. The method and useful lives of finite life intangible assets are reviewed annually. Changes in the expected pattern of consumption or useful life are accounted for prospectively by changing the amortisation method or period.
c. Trail Book intangible assets Trail book contracts and licences have a finite useful life and are carried at cost less accumulated amortisation and impairment losses. Amortisation is calculated using the straight-line method to allocate the cost of trail book and licences over their estimated useful lives.
d. Property Management intangible assets The property management rights are expected to have a finite life and are therefore amortised over their useful lives. The investment is carried at cost less accumulated amortisation and impairment losses. Amortisation is calculated using the straight-line method to allocate the cost of the rent roll over its estimated useful lives which is based on comparable market evidence.
e. Business and domain names Business and domain names are recognised at cost of acquisition. They have a finite useful life and are amortised on a systematic basis based on the future economic benefits to be obtained over its useful life. Amortisation is calculated using the straight-line method.
P a g e | 48
THE AGENCY GROUP AUSTRALIA LTD ANNUAL REPORT AND CONTROLLED ENTITIES 30 June 2022 ABN 52 118 913 232
Notes to the consolidated financial statements for the year ended 30 June 2022
Note 6 Non-financial assets and financial liabilities (cont.)
6.3 Intangible assets (cont.) f. Subsequent measurement The following useful lives are used in the calculation of amortisation: Class 2022 2021 % % ◼ Trail Book and Rent Roll intangible assets 15 15 ◼ Business and domain names 10 10
g. Goodwill Goodwill arising on an acquisition of a business is carried at cost as established at the date of the acquisition of the business (see note 11.1.1) less accumulated impairment losses, if any. For the purposes of impairment testing, goodwill is allocated to each of the Group’s cash-generating units (CGU) (or groups of CGUs) that is expected to benefit from the synergies of the combination. A CGU to which goodwill has been allocated is tested for impairment annually, or more frequently when there is an indication that the unit may be impaired. If the recoverable amount of the CGU is less than its carrying amount, the impairment loss is allocated first to reduce the carrying amount of any goodwill allocated to the unit and then to the other assets of the unit pro rata based on the carrying amount of each asset in the unit. Any impairment loss for goodwill is recognised directly in profit or loss. An impairment loss recognised for goodwill is not reversed in subsequent periods. On disposal of the relevant CGU, the attributable amount of goodwill is included in the determination of the profit or loss on disposal. 6.3.5 Key estimates and Critical Judgements– Impairment of intangibles a. Impairment of goodwill and rent roll Determining whether goodwill is impaired requires an estimation of the value in use of the cash generating units to which goodwill has been allocated. The value in use calculation requires management to estimate the future cash flows expected to arise from the cash-generating unit and a suitable discount rate in order to calculate present value. Where the actual future cash flows are less than expected, an impairment loss may arise. Included within the Top Level CGU is a rent roll asset of $10,013K (2021: $13,140K). These same CGU also included goodwill of $10,658K (2021: $10,658K). For the rent roll assets, the recoverable amounts of these CGU’s are derived from market transactional evidence in relation to their fair value. The Directors have determined that a multiple of 4 for the Top Level CGU (based on an independent expert opinion), multiplied by the annual rent roll income is an appropriate measure of the fair value of the rent roll assets. Fair value less cost to sell of the CGU was classified on a level 2 basis. No impairment resulted. Management performed a goodwill impairment test of the Top Level Real Estate Sales CGU (acquired in 2019) taking a conservative approach in preparing its value in use calculation in light of market uncertainty resulting from COVID. Management applied a discount rate of 15.5% resulting in no impairment loss for 2022 (2021: $nil). The Mortgage CGU was tested for impairment and the result far exceeded the carrying value. All value-in-use calculations were performed using Board approved budgets.
P a g e | 49
ANNUAL REPORT THE AGENCY GROUP AUSTRALIA LTD 30 June 2022 AND CONTROLLED ENTITIES ABN 52 118 913 232
Notes to the consolidated financial statements for the year ended 30 June 2022
Note 6 Non-financial assets and financial liabilities (cont.)
6.4 Provisions 2022 2021 $’000 $’000 6.4.1 Current Employee entitlements 1,814 1,406 Future fund referrals 658 1,159
2,472 2,565 6.4.2 Non-current Employee entitlements 53 63 Make good provisions 148 150 Future fund referrals 20 68
221 281
6.4.3 Movements in Carrying Amounts Employee Make good Future fund entitlements provisions referrals Total $’000 $’000 $’000 $’000
Carrying amount at 1 July 2021 – 1,469 150 1,227 2,846 Additions 1,139 – – 1,139 Disposals – – (510) (510) Amounts used during the year (741) (2) (39) (782)
Carrying amount at 30 June 2022 1,867 148 678 2,693 – – – –
6.4.4 Description of provisions a. Provision for employee benefits represents amounts accrued for annual leave (AL) and long service leave (LSL). The current portion for this provision includes the total amount accrued for AL entitlements and the amounts accrued for LSL entitlements that have vested due to employees having completed the required period of service. The Group does not expect the full amount of AL or LSL balances classified as current liabilities to be settled within the next 12 months. However, these amounts must be classified as current liabilities since the Group does not have an unconditional right to defer the settlement of these amounts in the event employees wish to use their leave entitlement. b. Make good provision. The Company is required to restore the leased premises to their original condition at the end of the respective lease terms. A make good provision has been recognised for the present value of the estimated expenditure required to remove any leasehold improvements. The Directors valued the make good provision based upon a third-party cost estimate provided to the Company. c. Provision for Future fund referrals is an incentive scheme provided to property partners for successfully referring property management and mortgage broking transactions. The referral fees are transferred into an asset growth model which creates an interest for the future benefit of the Property Partner, maturing after two years, which also assists to retain staff. The company estimates the value of the future fund referral provision using a probability weighting model which is based on historic information.
6.4.5 Accounting policy Provisions are recognised when the Group has a present obligation (legal or constructive) as a result of a past event, it is probable that an outflow of resources embodying economic benefits will be required to settle the obligation and a reliable estimate can be made of the amount of the obligation. Provisions are not recognised for future operating losses. When the Group expects some or all of a provision to be reimbursed, for example under an insurance contract, the reimbursement is recognised as a separate asset but only when the reimbursement is virtually certain. The expense relating to any provision is presented in the statement of comprehensive income net of any reimbursement.
P a g e | 50
THE AGENCY GROUP AUSTRALIA LTD ANNUAL REPORT AND CONTROLLED ENTITIES 30 June 2022 ABN 52 118 913 232
Notes to the consolidated financial statements for the year ended 30 June 2022
Note 6 Non-financial assets and financial liabilities (cont.)
6.4 Provisions (cont.) Provisions are measured at the present value or management’s best estimate of the expenditure required to settle the present obligation at the end of the reporting period. If the effect of the time value of money is material, provisions are discounted using a current pre-tax rate that reflects the risks specific to the liability. When discounting is used, the increase in the provision due to the passage of time is recognised as an interest expense. Provision is made for the amount of any dividend declared, being appropriately authorised and no longer at the discretion of the entity, on or before the end of the reporting period but not distributed at the end of the reporting date
6.5 Other Significant Accounting Policies related to Non-Financial Assets and Liabilities
6.5.1 Impairment of non-financial assets The carrying amounts of the Group’s non-financial assets, other than deferred tax assets (see accounting policy at note 4.9) are reviewed at each reporting date to determine whether there is any indication of impairment. If any such indication exists, then the asset’s recoverable amount is estimated. Goodwill and intangible assets that have an indefinite useful life are not subject to amortisation and are tested annually for impairment or more frequently if events or changes in circumstances indicate that they might be impaired. Other assets are reviewed for impairment whenever events or changes in circumstances indicate that the carrying amount may not be recoverable An impairment loss is recognised if the carrying amount of an asset or its cash-generating unit exceeds its recoverable amount. A cash-generating unit is the smallest identifiable asset group that generates cash flows that largely are independent from other assets and groups. Impairment losses are recognised in the income statement, unless the asset has previously been revalued, in which case the impairment loss is recognised as a reversal to the extent of that previous revaluation with any excess recognised through the income statement. Impairment losses recognised in respect of cash- generating units are allocated first to reduce the carrying amount of any goodwill allocated to the units and then to reduce the carrying amount of the other assets in the unit on a pro rata basis. The recoverable amount of an asset or cash-generating unit is the greater of its fair value less costs to sell and value in use. In assessing value in use, the estimated future cash flows are discounted to their present value using a pre-tax discount rate that reflects current market assessments of the time value of money and the risks specific to the asset. For an asset that does not generate largely independent cash inflows, the recoverable amount is determined for the cash-generating unit to which the asset belongs. Impairment losses recognised in prior periods are assessed at each reporting date for any indications that the loss has decreased or no longer exists. An impairment loss is reversed if there has been a change in the estimates used to determine the recoverable amount. An impairment loss is reversed only to the extent that the asset’s carrying amount does not exceed the carrying amount that would have been determined, net of depreciation and amortisation, if no impairment loss had been recognised.
P a g e | 51
ANNUAL REPORT THE AGENCY GROUP AUSTRALIA LTD 30 June 2022 AND CONTROLLED ENTITIES ABN 52 118 913 232
Notes to the consolidated financial statements for the year ended 30 June 2022
Note 7 Equity
7.1 Issued capital Note 2022 2021 2022 2021 No. No. $’000 $’000
Fully paid ordinary shares 428,575,921 428,575,916 43,635 43,635
2022 2021 2022 2021 7.1.1 Ordinary shares No. No. $’000 $’000 At the beginning of the year 428,575,916 298,954,431 43,635 39,396 Shares issued during the year: ◼ Convertible note conversion 5.7.4 – 115,621,485 – 3,613 ◼ Exercise of $0.027 options 7.3 – 12,000,000 – 546 ◼ Exercise of $0.0338 options 7.3 – 2,000,000 – 140 ◼ Conversion of cancelled 7.2.2 5 – – – performance shares Transaction costs relating to share issues – – – (60)
At reporting date 428,575,921 428,575,916 43,635 43,635
7.1.2 Ordinary shares entitle the holder to participate in dividends and the proceeds on winding up of the Company in proportion to the number of and amounts paid on the shares held. On a show of hands every holder of ordinary shares present at a meeting in person or by proxy, is entitled to one vote, and upon a poll each share is entitled to one vote. Ordinary shares have no par value and the Company does not have a limited amount of authorised capital. 7.1.3 Accounting policy Ordinary issued capital is recorded at the consideration received. Incremental costs directly attributable to the issue of ordinary shares and share options are recognised as a deduction from equity, net of any related income tax benefit. Ordinary issued capital bears no special terms or conditions affecting income or capital entitlements of the shareholders.
7.2 Performance equity Note 2022 2021 2022 2021 No. No. $’000 $’000
Performance equity 11,000,000 1,555,558 111 –
2022 2021 2022 2021 7.2.1 Performance equity movement No. No. $’000 $’000 At the beginning of the year 1,555,558 1,555,558 – – Performance equity changes during the year: ◼ Conversion of cancelled 7.2.2 (1,555,558) – – – performance shares ◼ Issue of performance rights 18.2.1 11,000,000 – 111 –
At reporting date 11,000,000 1,555,558 111 –
7.2.2 During the 2020 financial year, 2,222,251 performance shares converted into 2,222,251 ordinary shares upon achieving a 10% growth in the mortgage and finance business loan book within 18 months of settlement. The remaining 1,555,558 performance shares failed to vest (by achieving a 20-day volume VWAP on the ASX which equals or exceeds 3 times the re-quotation price of $0.02, at any time within 24 months of settlement) and expired. These performance shares converted to five only ordinary shares, during the year.
7.2.3 Performance rights will vest and convert into ordinary shares on a one for one basis on achievement of the milestones described at note 18.2.1. If a milestone is not achieved by the applicable date, the relevant performance rights will automatically lapse
P a g e | 52
THE AGENCY GROUP AUSTRALIA LTD ANNUAL REPORT AND CONTROLLED ENTITIES 30 June 2022 ABN 52 118 913 232
Notes to the consolidated financial statements for the year ended 30 June 2022
Note 7 Equity (cont.)
7.3 Options Note 2022 2021 2022 2021 No. No. $’000 $’000
Options 30,000,000 333,333 779 1,072
2022 2021 2022 2021 7.3.1 Options equity movement No. No. $’000 $’000 At the beginning of the year 333,333 104,181,760 1,072 929 Options issued/(lapsed) during the year: ◼ Issued in connection with 5.7.4 – 12,000,000 – 222 Convertible notes ◼ Exercise of $0.027 options – (12,000,000) – (222) ◼ Exercise of $0.0338 options – (2,000,000) – (73) ◼ Granted (and to be issued) to 18.2.2a 30,000,000 – 564 216 CEO in accordance with employment agreements ◼ Expiry of options (333,333) (101,848,427) (17) – ◼ Expired legacy option values – – (840) –
At reporting date 30,000,000 333,333 779 1,072
7.3.2 During the prior year, 12,000,000 options were issued as part of the convertible note.
7.4 Reserves Note 2022 2021 $’000 $’000 Share-based payment reserve: – –
◼ Performance rights 7.2 111 – ◼ Options 7.3 779 1,072
890 1,072 7.4.1 Share-based payment reserve The share-based payment reserve records the value of options and performance shares or rights issued by the Company to its employees or consultants.
P a g e | 53
ANNUAL REPORT THE AGENCY GROUP AUSTRALIA LTD 30 June 2022 AND CONTROLLED ENTITIES ABN 52 118 913 232
Notes to the consolidated financial statements for the year ended 30 June 2022
SECTION B. RISK This section of the notes discusses the Group’s exposure to various risks and shows how these could affect the Group’s financial position and performance.
Note 8 Financial risk management 8.1 Financial Risk Management Policies This note presents information about the Group’s exposure to each of the above risks, its objectives, policies and procedures for measuring and managing risk, and the management of capital. The Group’s financial instruments consist mainly of deposits with banks, short-term investments, and accounts payable and receivable. The Group does not speculate in the trading of derivative instruments. A summary of the Group’s financial assets and liabilities is shown below: Floating Fixed Non- Floating Fixed Non- Interest Interest interest 2022 Interest Interest interest 2021 Rate Rate Bearing Total Rate Rate Bearing Total $’000 $’000 $’000 $’000 $’000 $’000 $’000 $’000
Financial Assets ◼ Cash and cash equivalents 8,216 – – 8,216 5,096 – – 5,096 ◼ Trade and other receivables – – 11,248 11,248 – – 8,517 8,517 ◼ Bank guarantees and restricted cash – 624 – 624 – 613 – 613 ◼ Investments – – 212 212 – – – –
Total Financial Assets 8,216 624 11,460 20,300 5,096 613 8,517 14,226
Financial Liabilities at amortised cost ◼ Trade and other payables – – 14,918 14,918 – – 11,194 11,194 ◼ Borrowings 5,000 – – 5,000 5,000 – – 5,000 ◼ Leases – 4,391 – 4,391 – 5,845 – 5,845 ◼ Financial liabilities – Convertible notes – 4,021 – 4,021 – 4,883 – 4,883
Total Financial Liabilities 5,000 8,412 14,918 28,330 5,000 10,728 11,194 26,922
Net Financial Assets / (Liabilities) 3,216 (7,788) (3,458) (8,030) 96 (10,115) (2,677) (12,696)
8.2 Specific Financial Risk Exposures and Management The main risk the Group is exposed to through its financial instruments are credit risk, liquidity risk and market risk consisting of interest rate, foreign currency risk and equity price risk. The Group’s overall risk management program focuses on the unpredictability of financial markets and seeks to minimise potential adverse effects on the financial performance of the Group. The Board has overall responsibility for the establishment and oversight of the risk management framework. The Board adopts practices designed to identify significant areas of business risk and to effectively manage those risks in accordance with the Group’s risk profile. This includes assessing, monitoring and managing risks for the Group and setting appropriate risk limits and controls. The Group is not of a size nor is its affairs of such complexity to justify the establishment of a formal system for risk management and associated controls. Risk management is carried out by the full Board as the Group believes that it is crucial for all board members to be involved in this process. The Chairman, with the assistance of senior management as required, has responsibility for identifying, assessing, treating and monitoring risks and reporting to the Board on risk management.
P a g e | 54
THE AGENCY GROUP AUSTRALIA LTD ANNUAL REPORT AND CONTROLLED ENTITIES 30 June 2022 ABN 52 118 913 232
Notes to the consolidated financial statements for the year ended 30 June 2022
Note 8 Financial risk management (cont.) 8.2.1 Credit risk Exposure to credit risk relating to financial assets arises from the potential non-performance by counterparties of contract obligations that could lead to a financial loss to the Group. Credit risk refers to the risk that a counterparty will default on its contractual obligations resulting in financial loss to the Group. The Group has adopted a policy of only dealing with creditworthy counterparties and obtaining sufficient collateral where appropriate, as a means of mitigating the risk of financial loss from defaults. The Group only transacts with entities that are rated the equivalent of investment grade and above. This information is supplied by independent rating agencies where available and, if not available, the Group uses publicly available financial information and its own trading record to rate its major customers. The Group’s exposure and the credit ratings of its counterparties are continuously monitored, and the aggregate value of transactions concluded is spread amongst approved counterparties. Credit exposure is controlled by counterparty limits that are reviewed and approved by the risk management committee annually. The Group establishes an allowance for impairment that represents its estimate of incurred losses in respect of trade and other receivables.
◼ Credit risk exposures The maximum exposure to credit risk, arising from cash and cash equivalents and trade receivables, is limited to the carrying amount, net of any provisions for impairment of those assets, as disclosed in the statement of financial position and notes to the financial statements. Credit risk related to balances with banks and other financial institutions is managed by the Group in accordance with approved Board policy. Such policy requires that surplus funds are only invested with financial institutions residing in Australia, wherever possible. There are no significant concentrations of credit risk, whether through exposure to individual customers, specific industry sectors and/or regions.
◼ Impairment losses The ageing of the Group’s current trade and other receivables at reporting date was as follows: Past due but not Gross Impaired Net impaired 2022 2022 2022 2022 $’000 $’000 $’000 $’000 Trade receivables Not past due 6,432 – 6,432 – Past due up to 30 days 512 – 512 512 Past due 31 days to 90 days 208 – 208 208 Past due over 90 days 950 (187) 763 763 8,102 (187) 7,915 1,483 Other receivables Not past due 3,383 (50) 3,333 –
Total 11,485 (237) 11,248 1,483 Included in the aged trade receivables are invoices raised for commission on property developments which are unconditional however are payable upon completion. 8.2.2 Liquidity risk Liquidity risk is the risk that the Group will not be able to meet its financial obligations as they fall due. The Group’s approach to managing liquidity is to ensure, as far as possible, that it will always have sufficient liquidity to meet its liabilities when due, under both normal and stressed conditions, without incurring unacceptable losses or risking damage to the Group’s reputation. Ultimate responsibility for liquidity risk management rests with the Board, who have built an appropriate liquidity risk management framework for the management of the Group’s short, medium and long-term funding and liquidity management requirements. The Group manages liquidity risk by maintaining adequate reserves, banking facilities and reserve borrowing facilities by continuously monitoring forecast and actual cash flows and matching the maturity profiles of financial assets and liabilities. The Group’s ability to raise debt and / or equity funding in the market is paramount in this regard.
P a g e | 55
ANNUAL REPORT THE AGENCY GROUP AUSTRALIA LTD 30 June 2022 AND CONTROLLED ENTITIES ABN 52 118 913 232
Notes to the consolidated financial statements for the year ended 30 June 2022
Note 8 Financial risk management (cont.) The Group has no access to credit standby facilities or arrangements for further funding or borrowings in place. The non- interest bearing financial liabilities the Group had at the end of the reporting period were trade and other payables incurred in the normal course of the business. These were and were due within the normal 30-60 days terms of creditor payments. Interest-bearing liabilities of the Group comprised borrowings (note 5.6), convertible notes (note 5.7), and leases (note 6.2).
◼ Contractual Maturities The table below analyses the Group’s financial liabilities and assets into relevant maturity groupings based on the remaining period at the end of the reporting period to the contractual maturity date. The amounts disclosed in the table are the contractual undiscounted cash flows: Within 1 Year Greater Than 1 Year Total 2022 2021 2022 2021 2022 2021 $’000 $’000 $’000 $’000 $’000 $’000 Financial liabilities due for payment Trade and other payables 14,918 11,194 – – 14,918 11,194 Borrowings 5,000 – – 5,000 5,000 5,000 Financial liabilities – convertible notes 4,021 – – 4,883 4,021 4,883 Leases 1,836 1,828 2,555 4,017 4,391 5,845
Total contractual outflows 25,775 13,022 2,555 13,900 28,330 26,922 Financial assets Cash and cash equivalents 8,216 5,096 – – 8,216 5,096 Trade and other receivables 11,103 8,354 145 163 11,248 8,517 Bank guarantees and restricted cash – – 624 613 624 613 Investments – – 212 – 212 –
Total anticipated inflows 19,319 13,450 981 776 20,300 14,226
Net (outflow) / inflow on financial instruments (6,456) 428 (1,574) (13,124) (8,030) (12,696)
It is not expected that the cash flows included in the maturity analysis could occur significantly earlier or at significantly different amounts.
8.2.3 Market risk Market risk is the risk that changes in market prices, such as foreign exchange rates, interest rates and equity prices will affect the Group’s income or the value of its holdings of financial instruments. The objective of market risk management is to manage and control market risk exposures within acceptable parameters, while optimising the return.
The Group’s activities minimally expose it to the financial risks of changes in foreign currency exchange rates, commodity prices and exchange rates. The Group does not enter into derivative financial instruments including foreign exchange forward contracts to hedge against financial risk. There has been no change to the Group’s exposure to market risks or the manner in which it manages and measures the risk from the previous period.
a. Interest rate risk The Group are exposed to interest rate risk as the Group borrows funds at both fixed and floating interest rates. The risk is managed by the Group by maintaining an appropriate mix between fixed and floating rate borrowings.
The Group’s policy is to monitor the interest rate yield curve out to six months to ensure a balance is maintained between the liquidity of cash assets and the interest rate return. Cash at bank and in hand earns interest at floating rates based on daily bank deposit rates. The Group does not have any receivables or payables that may be affected by interest rate risk.
b. Foreign exchange risk The Group is not exposed to any material foreign exchange risk.
P a g e | 56
THE AGENCY GROUP AUSTRALIA LTD ANNUAL REPORT AND CONTROLLED ENTITIES 30 June 2022 ABN 52 118 913 232
Notes to the consolidated financial statements for the year ended 30 June 2022
Note 8 Financial risk management (cont.) c. Price risk Price risk relates to the risk that the fair value or future cash flows of a financial instrument will fluctuate because of changes in market prices. The Group does not presently hold material amounts subject to price risk. As such the Board considers price risk as a low risk to the Group.
8.2.4 Sensitivity Analyses The Group is not exposed to any material sensitivities.
8.2.5 Net Fair Values a. Fair value estimation The fair values of financial assets and financial liabilities are presented in the table in note 8.1 and can be compared to their carrying values as presented in the statement of financial position. Fair values are those amounts at which an asset could be exchanged, or a liability settled, between knowledgeable, willing parties in an arm’s length transaction.
Financial instruments whose carrying value is equivalent to fair value due to their nature include: ◼ Cash and cash equivalents; ◼ Trade and other receivables; and ◼ Trade and other payables.
The methods and assumptions used in determining the fair values of financial instruments are disclosed in the accounting policy notes specific to the asset or liability.
Note 9 Capital Management 9.1.1 Capital The Group manages its capital to ensure that entities in the Group will be able to continue as a going concern while maximising the return to stakeholders through the optimisation of the debt and equity balance. Capital is defined as the combination of contributed equity, reserves and net debt (borrowings less cash). The Board is responsible for monitoring and approving the capital management framework within which management operates. The Group’s objective when managing capital is to safeguard its ability to continue as a going concern, so that it can continue to provide returns for shareholders and benefits for other stakeholders such as employees. The Group focuses on interrelated financial parameters, including its gearing ratio, earnings growth, average cost of debt, gearing, weighted average debt maturity and borrowing capacity. These are taken into account when the Group makes decisions on how to invest its capital and evaluate its existing investments. The capital structure of the Group can be changed by paying distributions to shareholders, returning capital to shareholders, issuing new shares or selling assets.
9.1.2 Working Capital The working capital position of the Group was as follows: Note 2022 2021 $’000 $’000
Cash and cash equivalents 5.1 8,216 5,096 Trade and other receivables 5.2.1 11,103 8,354 Other current assets 5.4.1 497 324 Trade and other payables 5.5.1 (14,918) (11,194) Borrowings 5.6.1 (5,000) – Financial liabilities 5.7.1 (4,021) – Leases 6.2.2 (1,836) (1,828) Current provisions 6.4 (2,472) (2,565)
Working capital position (8,431) (1,813)
P a g e | 57
ANNUAL REPORT THE AGENCY GROUP AUSTRALIA LTD 30 June 2022 AND CONTROLLED ENTITIES ABN 52 118 913 232
Notes to the consolidated financial statements for the year ended 30 June 2022
SECTION C. GROUP STRUCTURE This section provides information which will help users understand how the Group structure affects the financial position and performance of the Group as a whole. In particular, there is information about: (a) changes to the structure that occurred during the year as a result of business combinations and the disposal of a discontinued operation. (b) transactions with non-controlling interests, and (c) interests in joint operations. A list of significant subsidiaries is provided in note 10 below. This note also discloses details about the Group’s equity accounted investments.
Note 10 Interest in subsidiaries 10.1 Information about principal subsidiaries The subsidiaries listed below have share capital consisting solely of ordinary shares which are held directly by the Group and the proportion of ownership interest held equals the voting rights held by the Group. Investments in subsidiaries are accounted for at cost. Each subsidiaries’ country of incorporation is also its principal place of business, being Australia: Entity name Class of Percentage Owned Entity name Class of Percentage Owned Shares 2022 2021 Shares 2022 2021 ◼ Agency Partners WA Pty Ltd Ord. 100 100 ◼ The Agency Project Sales VIC Pty Ord. 100 100 ◼ Ausnet Financial Planning Ord. 100 100 Ltd Services Pty Ltd ◼ The Agency Property Ord. 100 100 ◼ Ausnet Financial Pty Ltd Ord. 100 100 Management NSW Pty Ltd ◼ Ausnet Property Investment Fund Ord. 100 100 ◼ The Agency MDC QLD Pty Ltd Ord. 100 100 formerly The Agency Property Management QLD Pty Pty Ltd Ltd
◼ Ausnet Real Estate Services Pty Ord. 100 100 ◼ The Agency MDC Pty Ltd formerly The Ord. 100 100 Agency Property Management VIC Pty Ltd Ltd ◼ The Agency Real Estate Pty Ltd Ord. 100 100 ◼ Courtesy Real Estate (NSW) Pty Ord. 100 100 ◼ The Agency Sales NSW Pty Ltd Ord. 100 100 Ltd ◼ The Agency Sales QLD Pty Ltd Ord. 100 100 ◼ Jelina Holdings Pty Ltd Ord. 100 100 ◼ The Agency Sales VIC Pty Ltd Ord. 100 100 ◼ Move Property Solutions Pty Ltd Ord. 100 100 ◼ The Agency Strata Pty Ltd formerly Ord. 100 100 ◼ S.J. Laing & Son Pty Ltd Ord. 100 100 The Agency Auctions QLD Pty Ltd ◼ The Agency Auctions NSW Pty Ltd Ord. 100 100 ◼ The Real Estate Group Australia Ord. 100 100 ◼ The Agency Canberra Pty Ltd Ord. 100 100 Pty Ltd formerly The Agency Auctions VIC Pty Ltd ◼ Top Level Real Estate Holdings Pty Ord. 100 100 ◼ The Agency Commercial Real Ord. 100 100 Ltd Estate Pty Ltd ◼ Top Level Real Estate Pty Ltd Ord. 100 100 ◼ The Agency Marketing Pty Ltd Ord. 100 100 ◼ Top Level Real Estate Sales Pty Ltd Ord. 100 100 ◼ The Agency Project Sales NSW Pty Ord. 100 100 ◼ Value Partner Program Pty Ltd Ord. 100 100 Ltd ◼ The Agency Project Sales QLD Pty Ord. 100 100 ◼ Vision Capital Management Ltd Ord. 100 100 Ltd ◼ Westvalley Corporation Pty Ltd Ord. 100 100
P a g e | 58
THE AGENCY GROUP AUSTRALIA LTD ANNUAL REPORT AND CONTROLLED ENTITIES 30 June 2022 ABN 52 118 913 232
Notes to the consolidated financial statements for the year ended 30 June 2022
Note 11 Other Significant Accounting Policies related to Group Structure
11.1 Basis of consolidation As at reporting date, the assets and liabilities of all controlled entities have been incorporated into the consolidated financial statements as well as their results for the year then ended. Where controlled entities have entered (left) the Consolidated Group during the year, their operating results have been included (excluded) from the date control was obtained (ceased).
11.1.1 Business combinations Acquisitions of businesses are accounted for using the acquisition method. The consideration transferred in a business combination is measured at fair value, which is calculated as the sum of the acquisition‑date fair values of assets transferred by the Group, liabilities incurred by the Group to the former owners of the acquiree and the equity interest issued by the Group in exchange for control of the acquiree. Acquisition‑related costs are recognised in profit or loss as incurred. At the acquisition date, the identifiable assets acquired and the liabilities assumed are recognised at their fair value at the acquisition date, except that: ◼ deferred tax assets or liabilities and assets or liabilities related to employee benefit arrangements are recognised and measured in accordance with AASB 112 Income Taxes and AASB 119 Employee Benefits respectively; ◼ liabilities or equity instruments related to share‑based payment arrangements of the acquiree or share‑based payment arrangements of the Group entered into to replace share‑based payment arrangements of the acquiree are measured in accordance with AASB 2 Share‑Based Payments at the acquisition date; and ◼ assets (or disposal groups) that are classified as held for sale in accordance with AASB 5 Non‑current Assets Held for Sale and Discontinued Operations are measured in accordance with that Standard.
a. Goodwill Goodwill is measured as the excess of the sum of the consideration transferred, the amount of any non‑controlling interests in the acquiree, and the fair value of the acquirer’s previously held equity interest in the acquiree (if any) over the net of the acquisition‑date amounts of the identifiable assets acquired and the liabilities assumed. If, after reassessment, the net of the acquisition‑date amounts of the identifiable assets acquired and liabilities assumed exceeds the sum of the consideration transferred, the amount of any non‑controlling interests in the acquiree and the fair value of the acquirer’s previously held interest in the acquiree (if any), the excess is recognised immediately in profit or loss as a bargain purchase gain. When the consideration transferred by the Group in a business combination includes contingent consideration arrangement, the contingent consideration is measured at its acquisition‑date fair value and included as part of the consideration transferred in a business combination. Changes in fair value of the contingent consideration that qualify as measurement period adjustments are adjusted retrospectively, with corresponding adjustments against goodwill. Measurement period adjustments are adjustments that arise from additional information obtained during the measurement period (which cannot exceed one year from the acquisition date) about facts and circumstances that existed at the acquisition date. The subsequent accounting for changes in the fair value of the contingent consideration that do not qualify as measurement period adjustments depends on how the contingent consideration is classified. Contingent consideration that is classified as equity is not remeasured at subsequent reporting dates and its subsequent settlement is accounted for within equity. Other contingent consideration is remeasured to fair value at subsequent reporting dates with changes in fair value recognised in profit or loss. When a business combination is achieved in stages, the Group’s previously held interests in the acquired entity are remeasured to its acquisition‑date fair value and the resulting gain or loss, if any, is recognised in profit or loss. Amounts arising from interests in the acquiree prior to the acquisition date that have previously been recognised in other comprehensive income are reclassified to profit or loss, where such treatment would be appropriate if that interest were disposed of. If the initial accounting for a business combination is incomplete by the end of the reporting period in which the combination occurs, the Group reports provisional amounts for the items for which the accounting is incomplete. Those provisional amounts are adjusted during the measurement period, or additional assets or liabilities are recognised, to reflect new information obtained about facts and circumstances that existed as of the acquisition date that, if known, would have affected the amounts recognised as of that date.
P a g e | 59
ANNUAL REPORT THE AGENCY GROUP AUSTRALIA LTD 30 June 2022 AND CONTROLLED ENTITIES ABN 52 118 913 232
Notes to the consolidated financial statements for the year ended 30 June 2022
Note 11 Other Significant Accounting Policies related to Group Structure b. Intangible assets acquired in a business combination Intangible assets acquired in a business combination and recognised separately from goodwill are recognised initially at their fair value at the acquisition date (which is regarded as their cost). Subsequent to initial recognition, intangible assets acquired in a business combination are reported at cost less accumulated amortisation and accumulated impairment losses, on the same basis as intangible assets that are acquired separately.
c. Contingent liabilities acquired in a business combination Contingent liabilities acquired in a business combination are initially measured at fair value at the acquisition date. At the end of subsequent reporting periods, such contingent liabilities are measured at the higher of the amount that would be recognised in accordance with AASB 137 Provisions, Contingent Liabilities and Contingent Assets and the amount recognised initially less cumulative amount of income recognised in accordance with the principles of AASB 15 Revenue from Contracts with Customers.
11.1.2 Subsidiaries Subsidiaries are entities controlled by the Group. The financial statements of subsidiaries are included in the consolidated financial statements from the date that control commences until the date that control ceases. The accounting policies of subsidiaries have been changed when necessary to align them with the policies adopted by the Group. Equity interests in a subsidiary not attributable, directly or indirectly, to the Group are presented as non-controlling interests. The Group initially recognises non-controlling interests that are present ownership interests in subsidiaries and are entitled to a proportionate share of the subsidiary’s net assets on liquidation at either fair value or at the non-controlling interests’ proportionate share of the subsidiary’s net assets. Subsequent to initial recognition, non-controlling interests are attributed their share of profit or loss and each component of other comprehensive income. Non-controlling interests are shown separately within the equity section of the statement of financial position and statement of comprehensive income. The grant by the Company of options over its equity instruments to the employees of subsidiary undertakings in the Group is treated as a capital contribution to that subsidiary undertaking. The fair value of employee services received, measured by reference to the grant date fair value, is recognised over the vesting period as an increase to investment in subsidiary undertakings, with a corresponding credit to equity. Losses applicable to the non-controlling interests in a subsidiary are allocated to the non-controlling interests even if doing so causes the non-controlling interests to have a deficit balance. A list of controlled entities is contained in note 10 Interest in subsidiaries of the financial statements. 11.1.3 Loss of control Upon the loss of control, the Group derecognises the assets and liabilities of the subsidiary, any non-controlling interests and the other components of equity related to the subsidiary. Any surplus or deficit arising on the loss of control is recognised in profit or loss. If the Group retains any interest in the previous subsidiary, then such interests are measured at fair value at the date control is lost. Subsequently it is accounted for as an equity-accounted investee or as an available-for-sale financial asset depending on the level of influence retained.
11.1.4 Transactions eliminated on consolidation All intra-group balances and transactions, and any unrealised income and expenses arising from intra-group transactions, are eliminated in preparing the consolidated financial statements.
P a g e | 60
THE AGENCY GROUP AUSTRALIA LTD ANNUAL REPORT AND CONTROLLED ENTITIES 30 June 2022 ABN 52 118 913 232
Notes to the consolidated financial statements for the year ended 30 June 2022
SECTION D. UNRECOGNISED ITEMS This section of the notes provides information about items that are not recognised in the financial statements as they do not (yet) satisfy the recognition criteria. In addition to the items and transactions disclosed below, there are also unrecognised tax amounts – see note 4 Income tax.
Note 12 Commitments There are no material commitments to the Group as at 2022 (2021: Nil).
Note 13 Contingent liabilities There are no contingent liabilities as at 30 June 2022.
Note 14 Events subsequent to reporting date Other than the following, there have not been any other matter or circumstance that has arisen after balance date that has significantly affected, or may significantly affect, the operations of the Group, the results of those operations, or the state of affairs of the Group in future financial periods. 14.1 Acquisition of Bushby & Co Pty Ltd On 25 July 2022, the Company completed a share sale and purchase agreement (SPA) with the owners of Bushby & Co. Pty. Ltd. (Bushby & Co) pursuant to which The Agency acquired all the issued share capital of Bushby & Co. 14.1.1 Consideration The consideration for the acquisition will be funded via a financing facility with the Company’s primary funder Macquarie Bank and out of existing cash reserves. The consideration for the Acquisition consists of: a. a cash deposit of $210K which was paid on the date of the SPA, followed by a cash payment of $4.19M at completion, and a cash payment of $400K which consists of a retention payment payable by The Agency 90 days after the completion date subject to a retention adjustment; b. any management fee uplift in relation to rent roll properties, which (if payable) will be paid by The Agency six months after the completion date; c. any incentive payments, which (if payable) will be paid by The Agency in the first 2 years following completion; and d. any exchanged contract commissions in relation to pre-completion property contracts commission, which (if payable) will be paid by The Agency at the end of each calendar month.
14.2 Macquarie Bank Limited (“MBL”) Facility Amendment On 25 July 2022 the Company announced that it entered into an Amendment Deed in respect of its primary secured debt facility with MBL (the Facility). Pursuant to the terms of the Amendment Deed the Facility has been amended to: ◼ Facility Increased to $8.4M ($3.4M to assist in funding the Bushby & Co acquisition) ◼ Term 3 years, expiring on 20 July 2025 ◼ Interest Rate To remain at 3.75% p.a. + 30-day BBSW ◼ Establishment / Extension Fee 1.5% of total limits paid on settlement ◼ Financial Covenants MBL loan to rent roll valuation ratio: 40% and Cash Interest Cover > 3.0x ◼ Permitted Distributions Cash payment of interest on the Peters Investments Convertible Notes (quarterly), following evidence of covenant compliance ◼ Permitted Acquisitions Up to $500K per acquisition and no more than $1M in any 12-month period ◼ Investment Account The Agency will invest $3.8M into a MBL Investment Account for 120 days. The Agency agrees to not drawdown on the account until the approval date (if before this period) of the extension of the Convertible Notes by shareholders. Once approved, or if Peters Investments converts, The Agency can continue its investment with MBL or transfer into any other bank account facilities. All other terms remain the same as disclosed in note 5.6.3 14.3 Variation to terms of financial liabilities – Convertible notes On 22 July 2022, the Company signed a Deed of Variation to Convertible Note Agreement, to extend the terms of the convertible note to 22 January 2026, subject to subject to the Company obtaining all shareholder, statutory, third-party and regulatory approvals and/or waivers. All other terms and conditions of the Convertible Note Agreement, as detailed in note 5.7.4, remain in full force and effect.
P a g e | 61
ANNUAL REPORT THE AGENCY GROUP AUSTRALIA LTD 30 June 2022 AND CONTROLLED ENTITIES ABN 52 118 913 232
Notes to the consolidated financial statements for the year ended 30 June 2022
SECTION E. OTHER INFORMATION This section of the notes includes other information that must be disclosed to comply with the accounting standards and other pronouncements, but that is not immediately related to individual line items in the financial statements.
Note 15 Key Management Personnel compensation (KMP) The names and positions of KMP are as follows: ◼ Andrew Jensen Executive Chairman and Chief Operating Officer ◼ Geoff Lucas Managing Directors and Chief Executive Officer (CEO) (appointed 29 March 2021) ◼ Paul Niardone Executive Director ◼ Adam Davey Non-Executive Director ◼ Other KMP: Matt Lahood CEO – Real Estate ◼ Former KMP included in current and comparative information: Arjan van Ameyde Chief Financial Officer Appointed 1 February 2020, resigned 1 February 2022 Information regarding individual Directors and executives’ compensation and some equity instruments disclosures as required by the Corporations Regulations 2M.3.03 is provided in the Remuneration report table on page 17. 2022 2021 $ $ Short-term employee benefits 2,519,085 2,169,711 Post-employment benefits 109,774 92,200 Equity-settled share-based payments 674,553 215,946 Other long-term benefits – – Termination benefits 122,993 –
Total 3,426,405 2,477,857
Note 16 Related party transactions Some Directors or former Directors of the Group hold or have held positions in other companies, where it is considered they control or significantly influence the financial or operating policies of those entities. During the year, the following entities provided services to the Group. Total Transactions Receivable/(Payable) Balance Entity Nature of transactions KMP 2022 2021 2022 2021 $ $ $ $ Chapter One Advisers16a Public Relations Paul Niardone – 7,000 N/A N/A Matt Lahood Advance commissions / Matt Lahood (26,704) 90,000 57,370 84,074 Future fund Matt Lahood16b Loans Matt Lahood 345,009 – 345,009 –
a. Chapter One Advisers discontinued to be a related entity in July 2020 as Mr Niardone ceased to have any control or significantly influence the financial or operating policies of Chapter One Advisers. b. As a 30 June 2022, an amount of $345,009 was advanced to Mr Lahood (2021: nil). The terms of the advance include: ◼ Principal Sum Up to $400,000 ◼ Loan Commencement 27 October 2021 ◼ Interest Rate 8% per annum (after 12 months interest free period from final advance date). ◼ Default Interest Rate Interest Rate plus 5% per annum. ◼ Securities Any future sales commissions and future income and wages as per EA entitlements. ◼ Instalment Date Amount is due on final repayment date or when any due amounts are payable on STI payments and sales commissions from property sales that are due. Discretional payments during the term can also be paid. ◼ Repayment Date 31 March 2023
P a g e | 62
THE AGENCY GROUP AUSTRALIA LTD ANNUAL REPORT AND CONTROLLED ENTITIES 30 June 2022 ABN 52 118 913 232
Notes to the consolidated financial statements for the year ended 30 June 2022
Note 17 Earnings per share (EPS) Note 2022 2021 $’000 $’000 17.1 Reconciliation of earnings to profit or loss Profit / (loss) for the year 1,588 (1,856) Less: profit attributable to non-controlling equity interest – –
Profit / (loss) used in the calculation of basic and diluted EPS 1,588 (1,856)
2022 2021 No. No. 17.2 Weighted average number of ordinary shares outstanding during the year used in calculation of basic EPS 428,575,917 353,288,916 Weighted average number of dilutive equity instruments outstanding 17.5 5,808,219 N/A 17.3 Weighted average number of ordinary shares outstanding during the year used in calculation of diluted EPS 434,384,136 353,288,916
2022 2021 17.4 Earnings per share ₵ ₵ Basic EPS (cents per share) 17.5 0.37 (0.53) Diluted EPS (cents per share) 17.5 0.37 N/A
17.5 As at 30 June 2022, the Group has 30,000,000 unissued shares under options (2021: 333,333) and 11,000,000 performance shares on issue (30 June 2021: 1,555,558). As at 30 June 2022, of the 30,000,000 options granted and issued, 10,000,000 options have vested and are exercisable. No performance rights have vested. Unvested options and performance rights are not considered to be dilutive. In addition, the Group does not report diluted EPS on losses. During the 2021 year, the Group’s unissued shares under option and performance shares were anti-dilutive.
Note 18 Share-based payments Note 2022 2021 $ $ 18.1 Share-based payments: ◼ Recognised in profit and loss: Share-based payment expense – Performance rights 18.2.1,18.3 110,559 – Share-based payment expense – Options 18.2.2a,18.5 563,994 215,946 674,553 215,946 ◼ Recognised in net assets in Embedded Derivatives 18.2.2b – 222,000
Gross share-based payments 674,553 437,946
18.2 Share-based payment arrangements in effect during the period 18.2.1 Issued during the current year At the Company’s AGM, held 28 January 2022, shareholder approval was obtained to issue 11,000,000 performance rights that will convert into shares upon Performance Milestones being achieved, to Mr Paul Niardone under his Executive Services Agreement. These performance rights have been valued and issued on terms as detailed below and in note 18.3. Class of Performance Condition Performance Milestone Expiry Probability of Performance Performance rights Date Date milestones met Condition Right No. % Satisfied A 24 months continuous Company service 8,000,000 28.01.2024 28.01.2024 100 No B Achievement of one of the following: 3,000,000 30.06.2024 30.06.2024 85 No (iii) recruitment by The Agency (WA) and the Company’s Sell Lease Property Model of 85 Agents by 30 June 2024; or (iv) achievement of GCI of $50,000,000 for the financial year ending 30 June 2024 by The Agency (WA).
P a g e | 63
ANNUAL REPORT THE AGENCY GROUP AUSTRALIA LTD 30 June 2022 AND CONTROLLED ENTITIES ABN 52 118 913 232
Notes to the consolidated financial statements for the year ended 30 June 2022
Note 18 Share-based payments (cont.) 18.2.2 Issued in prior year, remaining in effect a. Chief Executive Officer – Remuneration Options On the commencement of employment, the Company granted Mr Geoff Lucas 30,000,000 options (to be issued) in accordance with his employment agreement, on the following terms: Number under Option Date of Expiry Consideration Exercise Price Vesting Terms 10,000,000 29 September 2022 nil $0.050 60 days after 6-month probationary period 28 November 2021 10,000,000 29 September 2023 nil $0.075 12 months after 6-month probationary period 29 September 2022 10,000,000 29 September 2024 nil $0.100 24 months after 6-month probationary period 29 September 2023 b. Convertible note – attaching options As detailed in note 5.7.4, 12,000,000 options were issued to Peters Investments Pty Ltd in connection with the provision of a convertible note. Number under Option Date of Expiry Consideration Exercise Price Vesting Terms 12,000,000 31 March 2023 nil $0.027 Immediately upon issue
18.3 Fair value of performance rights granted The fair value of the rights granted to employees is deemed to represent the value of the employee services received over the vesting period. Note reference 18.2.1 18.2.1 Grant date: 28 January 2022 28 January 2022 Grant date share price: $0.045 $0.045 Milestone date 28 January 2024 30 June 2024 Performance right conversion price: $nil $nil Number of rights issued: 8,000,000 3,000,000 Remaining life (years): 1.57 2.00 Value per right $0.045 $0.045 Probability of milestone being met (%): 100 85
Fair values: Total
Total fair value $360,000 $114,750 $474,750 Recognised in the period $83,836 $26,723 $110,559
Historical volatility has been the basis for determining expected share price volatility as it is assumed that this is indicative of future movements.
The life of the options is based on the historical exercise patterns, which may not eventuate in the future.
P a g e | 64
THE AGENCY GROUP AUSTRALIA LTD ANNUAL REPORT AND CONTROLLED ENTITIES 30 June 2022 ABN 52 118 913 232
Notes to the consolidated financial statements for the year ended 30 June 2022
Note 18 Share-based payments (cont.)
18.4 Movement in Company options share-based payment arrangements during the period A summary of the movements of all Company options issued as share-based payments is as follows: 2022 2021 Number of Weighted Average Number of Weighted Average Options Exercise Price Options Exercise Price Outstanding at the beginning of the year 30,333,333 $0.077 104,181,760 $0.068 Granted (refer 18.4a below) – – 42,000,000 $0.061 Exercised – – (14,000,000) $0.028 Expired (333,333) $0.300 (101,848,427) $0.068
Outstanding at year-end (refer 18.4a below) 30,000,000 $0.075 30,333,333 $0.077
Exercisable at year-end 10,000,000 $0.050 333,333 $0.300
a. Included in 2021 Granted and Outstanding at year-end are 30,000,000 options granted to Mr Geoff Lucas that are subject to vesting conditions and were issued on 30 November 2021. b. The weighted average remaining contractual life of options outstanding at year end was 1.25 years (2021: 2.23 years). c. The fair value of the options granted to employees is deemed to represent the value of the employee services received over the vesting period.
18.5 Fair value of options granted in prior period, remaining in effect The fair value of the options granted to employees is deemed to represent the value of the employee services received over the vesting period. The weighted average fair value of options granted during the year was $nil (2021: $0.0338). These values were calculated using the Black-Scholes option pricing model, applying the following inputs to options issued this year: Note reference 18.2.2a 18.2.2a 18.2.2a Grant date: 29 March 2021 29 March 2021 29 March 2021 Grant date share price: $0.060 $0.060 $0.060 Option exercise price: $0.050 $0.075 $0.100 Number of options issued: 10,000,000 10,000,000 10,000,000 Remaining life (years): 0.25 1.25 2.25 Expected share price volatility: 106.60 106.60 106.60 Risk-free interest rate: 0.08% 0.08% 0.66% Value per option $0.0320 $0.0333 $0.0360
Fair values: Total
Total fair value $320,000 $333,000 $360,000 $1,013,000 Recognised in the period $198,078 222,092 $143,824 $563,994
Historical volatility has been the basis for determining expected share price volatility as it is assumed that this is indicative of future movements.
The life of the options is based on the historical exercise patterns, which may not eventuate in the future.
P a g e | 65
ANNUAL REPORT THE AGENCY GROUP AUSTRALIA LTD 30 June 2022 AND CONTROLLED ENTITIES ABN 52 118 913 232
Notes to the consolidated financial statements for the year ended 30 June 2022
Note 18 Share-based payments (cont.)
18.5.1 Accounting policy The Group has provided payment to service providers and related parties in the form of share-based compensation whereby services are rendered in exchange for shares or rights over shares, equity-settled transactions. The cost of these equity- settled transactions is measured by reference to the fair value at the date at which they are granted. The fair value is determined using an appropriate valuation model for services provided by employees or where the fair value of the goods or services received cannot be reliably estimated. For goods and services received where the fair value can be determined reliably the goods and services and the corresponding increase in equity are measured at that fair value. The fair value of the options granted is adjusted to reflect market vesting conditions, but excludes the impact of any non-market vesting conditions. Non-market vesting conditions are included in assumptions about the number of options that are expected to become exercisable. At each balance date, the entity revises its estimates of the number of options with non-market vesting conditions that are expected to become exercisable. The cost of equity-settled transactions is recognised, together with a corresponding increase in equity, over the period in which the performance conditions are fulfilled, ending on the date on which the relevant parties become fully entitled to the award, vesting date. The cumulative expense recognised for equity-settled transactions at each reporting date until vesting date reflects (i) the extent to which the vesting period has expired and (ii) the number of awards that, in the opinion of the Directors of the Group, will ultimately vest. This opinion is formed based on the best available information at balance date. No adjustment is made for the likelihood of market performance conditions being met as the effect of these conditions is included in the determination of fair value at grant date. Where the terms of an equity-settled award are modified, as a minimum an expense is recognised as if the terms had not been modified. In addition, an expense is recognised for any increase in the value of the transaction as a result of the modification, as measured at the date of modification. 18.5.2 Key estimate a. Share-based payments The Group measures the cost of equity-settled transactions by reference to the fair value of the equity instrument at the date at which they are granted. The fair value of options granted is measured using the Black-Scholes option pricing model. The model uses assumptions and estimates as inputs. The assumptions and models used for estimating fair value for share-based payment transactions are disclosed in note 18.5.
Note 19 Auditor’s remuneration 2022 2021 $ $ Remuneration of the auditor for: ◼ Auditing or reviewing the financial reports: Hall Chadwick WA Audit Pty Ltd 151,000 146,000 ◼ Non-audit services provided by a related practice of the Auditor – 4,700
151,000 150,700
Note 20 Operating segments 20.1 Identification of reportable segments The Group has identified its operating segments based on the internal reports that are provided to the Board of Directors (the Board) monthly and in determining the allocation of resources. The Group is managed primarily based on service offerings as the diversification of the Group’s operations inherently have notably different risk profiles and performance assessment criteria. Operating segments are therefore determined on the same basis.
P a g e | 66
THE AGENCY GROUP AUSTRALIA LTD ANNUAL REPORT AND CONTROLLED ENTITIES 30 June 2022 ABN 52 118 913 232
Notes to the consolidated financial statements for the year ended 30 June 2022
Note 20 Operating segments (cont.) 20.2 Types of services by segment 20.2.1 Real Estate and Property Services This represents revenue received for provision of real estate services including selling of property, settlement agent services, and property management.
20.2.2 Mortgage Origination Services This represents revenue received for provision of mortgage broking services.
20.2.3 Other (includes financial planning, head office etc) This represents non-reportable segments including head office, property investments, and other services. 20.3 Basis of accounting for purposes of reporting by operating segments 20.3.1 Accounting policies adopted Unless stated otherwise, all amounts reported to the Board, being the chief decision maker with respect to operating segments, are determined in accordance with accounting policies that are consistent to those adopted in the annual financial statements of the Group.
20.3.2 Inter-segment transactions All such transactions are eliminated on consolidation of the Group’s financial statements.
Inter-segment loans payable and receivable are initially recognised at the consideration received/to be received net of transaction costs. If inter-segment loans receivable and payable are not on commercial terms, these are not adjusted to fair value based on market interest rates. This policy represents a departure from that applied to the statutory financial statements.
20.3.3 Segment assets Where an asset is used across multiple segments, the asset is allocated to that segment that receives majority economic value from that asset. In the majority of instances, segment assets are clearly identifiable on the basis of their nature and physical location. 20.3.4 Segment liabilities Liabilities are allocated to segments where there is a direct nexus between the incurrence of the liability and the operations of the segment. Borrowings and tax liabilities are generally considered to relate to the Group as a whole and are not allocated. Segment liabilities include trade and other payables and certain direct borrowings.
20.3.5 Unallocated items The following items of revenue, expenses, assets, and liabilities are not allocated to operating segments as they are not considered part of the core operations of any segment: ◼ Head office and corporate costs; ◼ Net gains on disposal of available-for-sale investments; ◼ Impairment of assets and other non-recurring items of revenue and expense; ◼ Income tax expense; ◼ Current and deferred tax assets and liabilities; ◼ Other financial assets; ◼ Intangibles assets; and ◼ Discontinued operations. 20.3.6 Segment information a. The Group’s operations are from Australian sources and therefore no geographical segments are disclosed. b. Assets and liabilities have not been reported on a segmented basis as the Board of Directors is provided with consolidated information. 20.4 Major customers The Group has a diversified range of customers across various geographic locations and businesses, and is not dependant on any one customer above 5%.
P a g e | 67
ANNUAL REPORT THE AGENCY GROUP AUSTRALIA LTD 30 June 2022 AND CONTROLLED ENTITIES ABN 52 118 913 232
Notes to the consolidated financial statements for the year ended 30 June 2022
Note 20 Operating segments (cont.)
20.5 Segment Financial Performance Real Estate Mortgage Total Property Origination Reportable Other Services Services Segments Segments Total 30 June 2022 $’000 $’000 $’000 $’000 $’000 Revenue ◼ External revenues 69,376 3,233 72,609 47 72,656 ◼ Inter-segment revenues – – – – –
Total segment revenue 69,376 3,233 72,609 47 72,656 Reconciliation of segment revenue to Group revenue: ◼ Eliminations –
Total group revenue and other income _ 72,656
Segment earnings before interest, tax, depreciation, and amortisation (EBITDA) 12,811 701 13,512 – 13,512 ◼ Unallocated corporate costs (7,825)
EBITDA _ 5,687 Reconciliation of segment loss to Group profit: (i) Allocated items: ◼ Gain on disposal of assets 5 – 5 1 6 ◼ Depreciation and amortisation (4,653) (49) (4,702) (737) (5,439) ◼ Net finance costs (449) 4 (445) (1,201) (1646) (ii) Unallocated items: ◼ Impairment reversal – – – 400 400 ◼ Fair value adjustments 123 – 123 2,005 2,128 ◼ Share-based payments – – – (675) (675)
Profit before income tax _ 461
30 June 2021 Revenue ◼ External revenues 55,315 3,052 58,367 13 58,380 ◼ Inter-segment revenues – – – – –
Total segment revenue 55,315 3,052 58,367 13 58,380 Reconciliation of segment revenue to Group revenue: ◼ Eliminations –
Total group revenue and other income _ 58,380
Segment earnings before interest, tax, depreciation and amortisation (EBITDA) 10,871 1,019 11,890 181 12,071 ◼ Unallocated corporate costs (5,704)
EBITDA _ 6,367 Reconciliation of segment loss to Group loss: (iii) Allocated items: ◼ Gain on disposal of assets 77 – 77 123 200 ◼ Depreciation and amortisation (5,204) (43) (5,247) (219) (5,466) ◼ Net finance costs (1,106) (3) (1,109) (1,139) (2,248) (iv) Unallocated items: ◼ Impairment reversal – – – (400) (400) ◼ Fair value adjustments – – – (1,987) (1,987) ◼ Share-based payments – – – (216) (216)
Loss before income tax _ (3,750)
P a g e | 68
THE AGENCY GROUP AUSTRALIA LTD ANNUAL REPORT AND CONTROLLED ENTITIES 30 June 2022 ABN 52 118 913 232
Notes to the consolidated financial statements for the year ended 30 June 2022
Note 21 Parent entity disclosures The Agency Group Australia Ltd is the ultimate Australian parent entity and ultimate parent of the Group. The Agency Group Australia Ltd did not enter into any trading transactions with any related party during the year.
21.1 Financial Position of The Agency Group Australia Ltd 2022 2021 $’000 $’000
Current assets 729 269 Non-current assets 4,239 6,768
Total assets 4,968 7,037
Current liabilities 4,968 1,181 Non-current liabilities – 5,856
Total liabilities 4,968 7,037
Net assets – –
Equity Issued capital 43,635 43,635 Share-based payment reserve 890 1,072 Accumulated losses (44,525) (44,707)
Total equity – –
21.2 Financial performance of The Agency Group Australia Ltd 2022 2021 $’000 $’000
Loss for the year (675) (1,524) Other comprehensive income – –
Total comprehensive income (675) (1,524)
21.3 Contractual commitments The parent company has no capital commitments at 2022 (2021: $nil). The parent company other commitments are disclosed in note 12 Commitments.
21.4 Contingent liabilities and guarantees There are no guarantees entered into by The Agency Group Australia Ltd for the debts of its subsidiaries as at 2022 (2021: none). The parent company other contingencies are disclosed in note 13 Contingent liabilities.
P a g e | 69
ANNUAL REPORT THE AGENCY GROUP AUSTRALIA LTD 30 June 2022 AND CONTROLLED ENTITIES ABN 52 118 913 232
Notes to the consolidated financial statements for the year ended 30 June 2022
Note 22 Statement of significant accounting policies This note provides a list of the significant accounting policies adopted in the preparation of these consolidated financial statements to the extent they have not already been disclosed in the other notes above. These policies have been consistently applied to all the years presented, unless otherwise stated.
22.1 Basis of preparation 22.1.1 Reporting Entity The Agency Group Australia Ltd (The Agency or the Company) is a listed public company limited by shares, domiciled and incorporated in Australia. These are the consolidated financial statements and notes of The Agency and controlled entities (collectively the Group). The financial statements comprise the consolidated financial statements of the Group. For the purposes of preparing the consolidated financial statements, the Company is a for-profit entity. The Group is a for-profit entity and is primarily involved in the integrated real estate services. The separate financial statements of The Agency, as the parent entity, have not been presented with this financial report as permitted by the Corporations Act 2001 (Cth). 22.1.2 Basis of accounting These financial statements are general purpose financial statements which have been prepared in accordance with Australian Accounting Standards and Interpretations of the Australian Accounting Standards Board (AAS Board) and International Financial Reporting Standards (IFRS) as issued by the International Accounting Standards Board (IASB), and the Corporations Act 2001 (Cth). Australian Accounting Standards (AASBs) set out accounting policies that the AAS Board has concluded would result in a financial report containing relevant and reliable information about transactions, events and conditions to which they apply. Compliance with AASBs ensures that the financial statements and notes also comply with IFRS as issued by the IASB. The financial statements were authorised for issue on 24 August 2022 by the Directors of the Company. 22.1.3 Going Concern The financial report has been prepared on a going concern basis, which contemplates the continuity of normal business activity and the realisation of assets and the settlement of liabilities in the ordinary course of business. The Group incurred a profit for the year of $1.59 million (2021: $1.86 million loss) and a net cash in-flow from operating activities of $6.60 million (2021: $4.64 million in-flow). Included in profit for during the year was depreciation and amortisation of $5.44 million, embedded derivative non-cash financing gain of $1.14 million, and impairment recovery of $0.40 million. As at 30 June 2022, the Company had a working capital deficit of $8.43 million (2021: $1.81 million working capital deficit). Subsequent to balance date, the terms of both the borrowing and financial liabilities were renegotiated, as disclosed in note 14.2 and 14.3. The Directors have prepared a cash flow forecast, which indicates that the Group will have sufficient cash flows to meet commitments and working capital requirements for the 12-month period from the date of signing this financial report. The ability of the Group to continue as a going concern is principally dependent on the following: ◼ The Group continuing to generate cash flows from profitable operations; and ◼ The Group being in compliance with all terms of its debt facilities and not breaching the terms of its borrowing facilities. In the event the above are not achieved the Group will need to raise funds from issued capital and/or alternative financing arrangements. Based on the cash flow forecasts and other factors referred to above, the directors are satisfied that the going concern basis of preparation is appropriate. In particular, given the Group’s history of raising capital to date, the directors are confident of the Group’s ability to raise additional funds as and when they are required. 22.1.4 Comparative figures Where required by AASBs comparative figures have been adjusted to conform to changes in presentation for the current financial year. Where the Group retrospectively applies an accounting policy, makes a retrospective restatement or reclassifies items in its financial statements, an additional (third) statement of financial position as at the beginning of the preceding period in addition to the minimum comparative financial statements is presented.
P a g e | 70
THE AGENCY GROUP AUSTRALIA LTD ANNUAL REPORT AND CONTROLLED ENTITIES 30 June 2022 ABN 52 118 913 232
Notes to the consolidated financial statements for the year ended 30 June 2022
Note 22 Statement of significant accounting policies
22.1.5 New and Amended Standards Adopted by the Group The Group has applied the following standards and amendments for the first time for their annual reporting period commencing 1 July 2021: ◼ AASB 2020-8 Amendments to Australian Accounting Standards – Interest Rate Benchmark Reform – Phase 2 ◼ AASB 2021-3 Amendments to Australian Accounting Standards – Covid-19-Related Rent Concessions beyond 30 June 2021 The amendments listed above did not have any impact on the amounts recognised in prior periods and are not expected to significantly affect the current or future periods. 22.2 Goods and Services Tax Goods and Services Tax (GST) is and Australian broad-based consumption taxes that the Group is exposed to. Revenues, expenses, and assets are recognised net of the amount of GST, except where the amount of GST incurred is not recoverable from the taxation authority. In these circumstances the GST is recognised as part of the cost of acquisition of the asset or as part of an item of the expense. Receivables and payables in the statement of financial position are shown inclusive of GST. The net amount of GST recoverable from, or payable to, the Australian Taxation Office (or jurisdictional equivalent) is included as a current asset or liability in the balance sheet. Cash flows are presented in the statement of cash flows on a gross basis, except for the GST component of investing and financing activities, which are disclosed as operating cash flows. Commitments and contingencies are disclosed net of the amount of GST recoverable from, or payable to, the taxation authority. 22.3 Foreign currency transactions and balances 22.3.1 Functional and presentation currency The functional currency of each of the Group’s entities is measured using the currency of the primary economic environment in which that entity operates. The consolidated financial statements are presented in Australian dollars which is the legal parent entity’s functional and presentation currency. The functional currency of the Group is the Australian Dollar. 22.4 Use of estimates and judgments The preparation of consolidated financial statements requires management to make judgements, estimates and assumptions that affect the application of policies and reported amounts of assets and liabilities, income and expenses. These estimates and associated assumptions are based on historical experience and various factors that are believed to be reasonable under the circumstances, the results of which form the basis of making the judgements about carrying values of assets and liabilities that are not readily apparent from other sources. Actual results may differ from these estimates. Estimates and underlying assumptions are reviewed on an ongoing basis. Revisions to accounting estimates are recognised in the period in which the estimate is revised and in any future periods affected. Judgements made by management in the application of AASBs that have significant effect on the consolidated financial statements and estimates with a significant risk of material adjustment in the next year are discussed in Note 22.4.1. 22.4.1 Critical Accounting Estimates and Judgments Management discusses with the Board the development, selection and disclosure of the Group’s critical accounting policies and estimates and the application of these policies and estimates. The estimates and judgements that have a significant risk of causing a material adjustment to the carrying amounts of assets and liabilities within the next financial year are discussed below. a. Key estimate – Taxation …………………………………………………………………………… Refer note 4.8 of the Income tax note. b. Key judgement and keys estimate – Impairment of goodwill and rent roll ….. Refer note 6.3 Intangible assets. c. Key judgement – determining the lease term ……………………………………………. Refer note 6.2 Leases. d. Key estimate – determining convertible note embedded derivative …………… Refer note 5.7 Financial liabilities. e. Key estimate – Share-base payments ………………………………………………………. Refer note 18 Share-based payments.
P a g e | 71
ANNUAL REPORT THE AGENCY GROUP AUSTRALIA LTD 30 June 2022 AND CONTROLLED ENTITIES ABN 52 118 913 232
Notes to the consolidated financial statements for the year ended 30 June 2022
Note 22 Statement of significant accounting policies
22.4.2 Coronavirus (COVID-19) pandemic Judgement has been exercised in considering the impacts that the COVID-19 pandemic has had, or may have, on the consolidated entity based on known information. This consideration extends to the nature of the supply chain, staffing and geographic regions in which the consolidated entity operates. Other than as addressed in specific notes, there does not currently appear to be either any significant impact upon the financial statements or any significant uncertainties with respect to events or conditions which may impact the consolidated entity unfavourably as at the reporting date or subsequently as a result of the COVID-19 pandemic. 22.5 Fair Value 22.5.1 Fair Value of Assets and Liabilities The Group measures some of its assets and liabilities at fair value on either a recurring or non-recurring basis, depending on the requirements of the applicable AASB. Fair value is the price the Group would receive to sell an asset or would have to pay to transfer a liability in an orderly unforced transaction between independent, knowledgeable, and willing market participants at the measurement date. As fair value is a market-based measure, the closest equivalent observable market pricing information is used to determine fair value. Adjustments to market values may be made having regard to the characteristics of the specific asset or liability. The fair values of assets and liabilities that are not traded in an active market are determined using one or more valuation techniques. These valuation techniques maximise, to the extent possible, the use of observable market data. To the extent possible, market information is extracted from either the principal market for the asset or liability (i.e. the market with the greatest volume and level of activity for the asset or liability) or, in the absence of such a market, the most advantageous market available to the entity at the end of the reporting period (i.e. the market that maximises the receipts from the sale of the asset or minimises the payments made to transfer the liability, after taking into account transaction costs and transport costs). For non-financial assets, the fair value measurement also considers a market participant’s ability to use the asset in its highest and best use or to sell it to another market participant that would use the asset in its highest and best use. The fair value of liabilities and the entity’s own equity instruments (excluding those related to share-based payment arrangements) may be valued, where there is no observable market price in relation to the transfer of such financial instruments, by reference to observable market information where such instruments are held as assets. Where this information is not available, other valuation techniques are adopted and, where significant, are detailed in the respective note to the financial statements. 22.5.2 Fair value hierarchy AASB 13 Fair Value Measurement requires the disclosure of fair value information by level of the fair value hierarchy, which categorises fair value measurements into one of three possible levels based on the lowest level that an input that is significant to the measurement can be categorised into as follows: Level 1 Level 2 Level 3 Measurements based on quoted prices Measurements based on inputs other than Measurements based on unobservable (unadjusted) in active markets for quoted prices included in Level 1 that are inputs for the asset or liability. identical assets or liabilities that the observable for the asset or liability, either entity can access at the measurement directly or indirectly. date.
The fair values of assets and liabilities that are not traded in an active market are determined using one or more valuation techniques. These valuation techniques maximise, to the extent possible, the use of observable market data. If all significant inputs required to measure fair value are observable, the asset or liability is included in Level 2. If one or more significant inputs are not based on observable market data, the asset or liability is included in Level 3. The Group would change the categorisation within the fair value hierarchy only in the following circumstances: ◼ if a market that was previously considered active (Level 1) became inactive (Level 2 or Level 3) or vice versa; or ◼ if significant inputs that were previously unobservable (Level 3) became observable (Level 2) or vice versa. When a change in the categorisation occurs, the Group recognises transfers between levels of the fair value hierarchy (i.e. transfers into and out of each level of the fair value hierarchy) on the date the event or change in circumstances occurred.
P a g e | 72
THE AGENCY GROUP AUSTRALIA LTD ANNUAL REPORT AND CONTROLLED ENTITIES 30 June 2022 ABN 52 118 913 232
Notes to the consolidated financial statements for the year ended 30 June 2022
Note 22 Statement of significant accounting policies
22.5.3 Valuation techniques The Group selects a valuation technique that is appropriate in the circumstances and for which sufficient data is available to measure fair value. The availability of sufficient and relevant data primarily depends on the specific characteristics of the asset or liability being measured. The valuation techniques selected by the Group are consistent with one or more of the following valuation approaches: ◼ Market approach: valuation techniques that use prices and other relevant information generated by market transactions for identical or similar assets or liabilities. ◼ Income approach: valuation techniques that convert estimated future cash flows or income and expenses into a single discounted present value. ◼ Cost approach: valuation techniques that reflect the current replacement cost of an asset at its current service capacity. Each valuation technique requires inputs that reflect the assumptions that buyers and sellers would use when pricing the asset or liability, including assumptions about risks. When selecting a valuation technique, the Group gives priority to those techniques that maximise the use of observable inputs and minimise the use of unobservable inputs. Inputs that are developed using market data (such as publicly available information on actual transactions) and reflect the assumptions that buyers and sellers would generally use when pricing the asset or liability are considered observable, whereas inputs for which market data is not available and therefore are developed using the best information available about such assumptions are considered unobservable. 22.6 New Accounting Standards and Interpretations not yet mandatory or early adopted Certain new accounting standards and interpretations have been published that are not mandatory for 30 June 2022 reporting periods and have not been early adopted by the Group. These standards are not expected to have a material impact on the entity in the current or future reporting periods and on foreseeable future transactions.
Note 23 Company details
The registered office and head office of the Company is: Street: 68 Milligan Street Postal: PO Box 7768 Perth WA 6000 CLOISTERS SQUARE WA 6850 Australia Australia
P a g e | 73
ANNUAL REPORT THE AGENCY GROUP AUSTRALIA LTD 30 June 2022 AND CONTROLLED ENTITIES ABN 52 118 913 232
Directors’ declaration
The Directors of the Company declare that:
1. The financial statements and notes, as set out on pages 23 to 73, are in accordance with the Corporations Act 2001 (Cth) and:
(a) comply with Accounting Standards;
(b) are in accordance with International Financial Reporting Standards issued by the International Accounting Standards Board, as stated in note 22.1 to the financial statements; and
(c) give a true and fair view of the financial position as at 30 June 2022 and of the performance for the year ended on that date of the Group.
(d) the Directors have been given the declarations required by section 295A of the Corporations Act 2001 (Cth);
2. in the Directors’ opinion there are reasonable grounds to believe that the Company will be able to pay its debts as and when they become due and payable.
This declaration is made in accordance with a resolution of the Board of Directors and is signed for and on behalf of the Directors by:
GEOFF LUCAS Managing Director and CEO Dated this Wednesday, 24 August 2022
P a g e | 74
THE AGENCY GROUP AUSTRALIA LTD ANNUAL REPORT AND CONTROLLED ENTITIES 30 June 2022 ABN 52 118 913 232
Independent auditor’s report
P a g e | 75
ANNUAL REPORT THE AGENCY GROUP AUSTRALIA LTD 30 June 2022 AND CONTROLLED ENTITIES ABN 52 118 913 232
P a g e | 76
THE AGENCY GROUP AUSTRALIA LTD ANNUAL REPORT AND CONTROLLED ENTITIES 30 June 2022 ABN 52 118 913 232
P a g e | 77
ANNUAL REPORT THE AGENCY GROUP AUSTRALIA LTD 30 June 2022 AND CONTROLLED ENTITIES ABN 52 118 913 232
P a g e | 78
THE AGENCY GROUP AUSTRALIA LTD ANNUAL REPORT AND CONTROLLED ENTITIES 30 June 2022 ABN 52 118 913 232
P a g e | 79
ANNUAL REPORT THE AGENCY GROUP AUSTRALIA LTD 30 June 2022 AND CONTROLLED ENTITIES ABN 52 118 913 232
Corporate governance statement The Board is responsible for establishing the Company’s corporate governance framework. In establishing its corporate governance framework, the Board has referred to the 4th edition of the ASX Corporate Governance Councils’ Corporate Governance Principles and Recommendations. The Corporate Governance Statement discloses the extent to which the Company follows the recommendations. The Company will follow each recommendation where the Board has considered the recommendation to be an appropriate benchmark for its corporate governance practices. Where the Company’s corporate governance practices will follow a recommendation, the Board has made appropriate statements reporting on the adoption of the recommendation. In compliance with the “if not, why not” reporting regime, where, after due consideration, the Company’s corporate governance practices will not follow a recommendation, the Board has explained its reasons for not following the recommendation and disclosed what, if any, alternative practices the Company will adopt instead of those in the recommendation. The Company’s governance-related documents can be found on its website at www.investors.theagency.com.au/corporate- governance.
P a g e | 80
THE AGENCY GROUP AUSTRALIA LTD ANNUAL REPORT AND CONTROLLED ENTITIES 30 June 2022 ABN 52 118 913 232
Additional Information for Listed Public Companies The following additional information is required by the Australian Securities Exchange in respect of listed public companies. 1 Capital as at 11 August 2022.
a. Ordinary share capital 428,575,921 ordinary fully paid shares held by 978 shareholders.
b. Options over Unissued Shares Number of Exercise Price Expiry ASX Options $ Date Status 10,000,000 0.050 30 Sept 2022 Unlisted 10,000,000 0.075 29 Sept 2023 Unlisted 10,000,000 0.100 29 Sept 2024 Unlisted
30,000,000
c. Performance Rights over Unissued Shares Class of Performance Condition Performance Milestone Date Expiry Date Performance rights Right No. Class A 24 months continuous service to the Company 8,000,000 28 January 2024 28 January 2024 Class B Achievement of one of the following: 3,000,000 30 June 2024 30 June 2024 (i) recruitment by The Agency (WA) and the Company’s Sell Lease Property Model of 85 Agents by 30 June 2024; or (ii) achievement of gross commission income of $50,000,000 for the financial year ending 30 June 2024 by The Agency (WA).
11,000,000
d. Voting Rights The voting rights attached to each class of equity security are as follows: ◼ Ordinary shares: Each ordinary share is entitled to one vote when a poll is called, otherwise each member present at a meeting or by proxy has one vote on a show of hands. ◼ Options: Options do not entitle the holders to vote in respect of that equity instrument, nor participate in dividends, when declared, until such time as the options are exercised or performance shares convert and subsequently registered as ordinary shares. ◼ Performance Rights: A Performance Right does not entitle a Holder to vote on any resolutions proposed at a general meeting of shareholders of the Company. A Performance Right does not entitle a Holder to any dividends. A Performance Right does not entitle the Holder to participate in the surplus profits or assets of the Company upon winding up of the Company. A Performance Right is not transferable.
e. Substantial Shareholders as at 11 August 2022. Name Number of Ordinary % Held of Issued Ordinary Fully Paid Shares Held Capital Peters Investments Pty Ltd 129,621,485 30.24 Ben Collier Investments Pty Ltd <Ben Collier Investments Pty Ltd> 27,060,515 6.31 MAK Property Group Pty Ltd <MAK A/C> 25,690,547 5.99 Teldar Real Estate Pty Ltd <MJ Lahood Family A/C> 24,349,790 5.68
P a g e | 81
ANNUAL REPORT THE AGENCY GROUP AUSTRALIA LTD 30 June 2022 AND CONTROLLED ENTITIES ABN 52 118 913 232
Additional Information for Listed Public Companies
f. Distribution of Shareholders as at 11 August 2022. Category (size of holding) Total Holders Number % Held of Issued Ordinary Ordinary Capital 1 – 1,000 223 36,998 0.01 1,001 – 5,000 107 291,321 0.07 5,001 – 10,000 104 808,223 0.19 10,001 – 100,000 344 13,067,600 3.05 100,001 – and over 200 414,371,779 96.68
978 428,575,921 100.00
g. Unmarketable Parcels as at 11 August 2022. There were 467 shareholders who held less than a marketable parcel of shares, holding 1,502,139 shares.
h. On-Market Buy-Back There is no current on-market buy-back.
i. Restricted Securities The Company has currently no restricted securities. However, ordinary shares issued upon conversion of the Performance Rights will be voluntarily escrowed for one year from the date of issue of the Shares.
j. 20 Largest Shareholders — Ordinary Shares as at 11 August 2022. Rank Name Number of Ordinary % Held of Issued Fully Paid Shares Ordinary Capital Held 1. Peters Investments Pty Ltd 129,621,485 30.24 2. Ben Collier Investments Pty Ltd <Ben Collier Investments P/L> 27,060,515 6.31 3. MAK Property Group Pty Ltd <MAK A/C> 25,690,547 5.99 4. Teldar Real Estate Pty Ltd <Mj Lahood Family A/C> 24,349,790 5.68 5. SEMC 2 Pty Limited <The Chen Asset A/C> 17,475,530 4.08 6. Hanzheng KSW Pty Ltd <Hanzheng KSW Unit A/C> 16,666,667 3.89 7. Daring Investments Pty Ltd 13,770,150 3.21 8. Mr Andrew Ernest Goodall 8,000,000 1.87 9. Honan Insurance Group Pty Ltd 7,692,308 1.79 10. Dawney & Co Ltd 7,500,000 1.75 11. Mr Irwin David Klotz 7,314,032 1.71 12. Nutsville Pty Ltd <Indust Electric Co S/F A/C> 6,763,230 1.58 13. Daring Investments Pty Ltd <Kolenda Family A/C> 5,853,980 1.37 14. BNP Paribas Nominees Pty Ltd grouped 5,012,759 1.17 15. Martianne Pty Ltd <Crabb Family Invest No 2 A/C> 5,000,000 1.17 16. Profess Investments Pty Ltd <Brutus Superannuation A/C> 4,886,026 1.14 17. CS Fourth Nominees Pty Limited <HSBC Cust Nom Au Ltd 11 A/C> 4,856,168 1.13 18. Crossbay Pty Ltd 4,218,934 0.98 19. Big Leap Super Pty Ltd <Big Leap Super A/C> 3,536,976 0.83 20. Trindis Pty Ltd 3,186,951 0.74
Total 328,456,048 76.63
P a g e | 82
THE AGENCY GROUP AUSTRALIA LTD ANNUAL REPORT AND CONTROLLED ENTITIES 30 June 2022 ABN 52 118 913 232
Additional Information for Listed Public Companies
k. Unquoted Securities Holders Holding More than 20% of the Class as at 11 August 2022.
◼ Unlisted Options (Exercise price $0.05, Expiry Date: 30.09.22) Rank Name Number of % Held of Unquoted Unquoted Securities Security Class G & N Lucas Investments Pty Ltd 10,000,000 100.00
Total 10,000,000 100.00
Total Unlisted Options (Exercise Price $0.05, Expiry Date: 30.09.22) 10,000,000
◼ Unlisted Options (Exercise price $0.075, Expiry Date: 29.09.23) Rank Name Number of % Held of Unquoted Unquoted Securities Security Class G & N Lucas Investments Pty Ltd 10,000,000 100.00
Total 10,000,000 100.00
Total Unlisted Options (Exercise Price $0.075, Expiry Date: 29.09.23) 10,000,000
◼ Unlisted Options (Exercise price $0.10, Expiry Date: 29.09.24) Rank Name Number of % Held of Unquoted Unquoted Securities Security Class G & N Lucas Investments Pty Ltd 10,000,000 100.00
Total 10,000,000 100.00
Total Unlisted Options (Exercise Price $0.10, Expiry Date: 29.09.24) 10,000,000
◼ Class A Performance Rights Holders Name Number of % Held of Unquoted Unquoted Securities Security Class Paul Niardone 8,000,000 100.00
Total 8,000,000 100.00
Total Performance Shares 8,000,000
◼ Class B Performance Rights Holders Name Number of % Held of Unquoted Unquoted Securities Security Class Paul Niardone 3,000,000 100.00
Total 3,000,000 100.00
Total Performance Shares 3,000,000
2 The Company Secretary is Stuart Usher.
3 Principal registered office As disclosed in note 23 Company details on page 73 of this Annual Report.
4 Registers of securities As disclosed in the Corporate directory on page i of this Annual Report.
5 Stock exchange listing Quotation has been granted for all the ordinary shares of the Company on all Member Exchanges of the Australian Securities Exchange Limited, as disclosed in the Corporate directory on page i of this Annual Report.
P a g e | 83