The Agency Delivers Record FY26 GCI & Stronger Earnings
View original announcement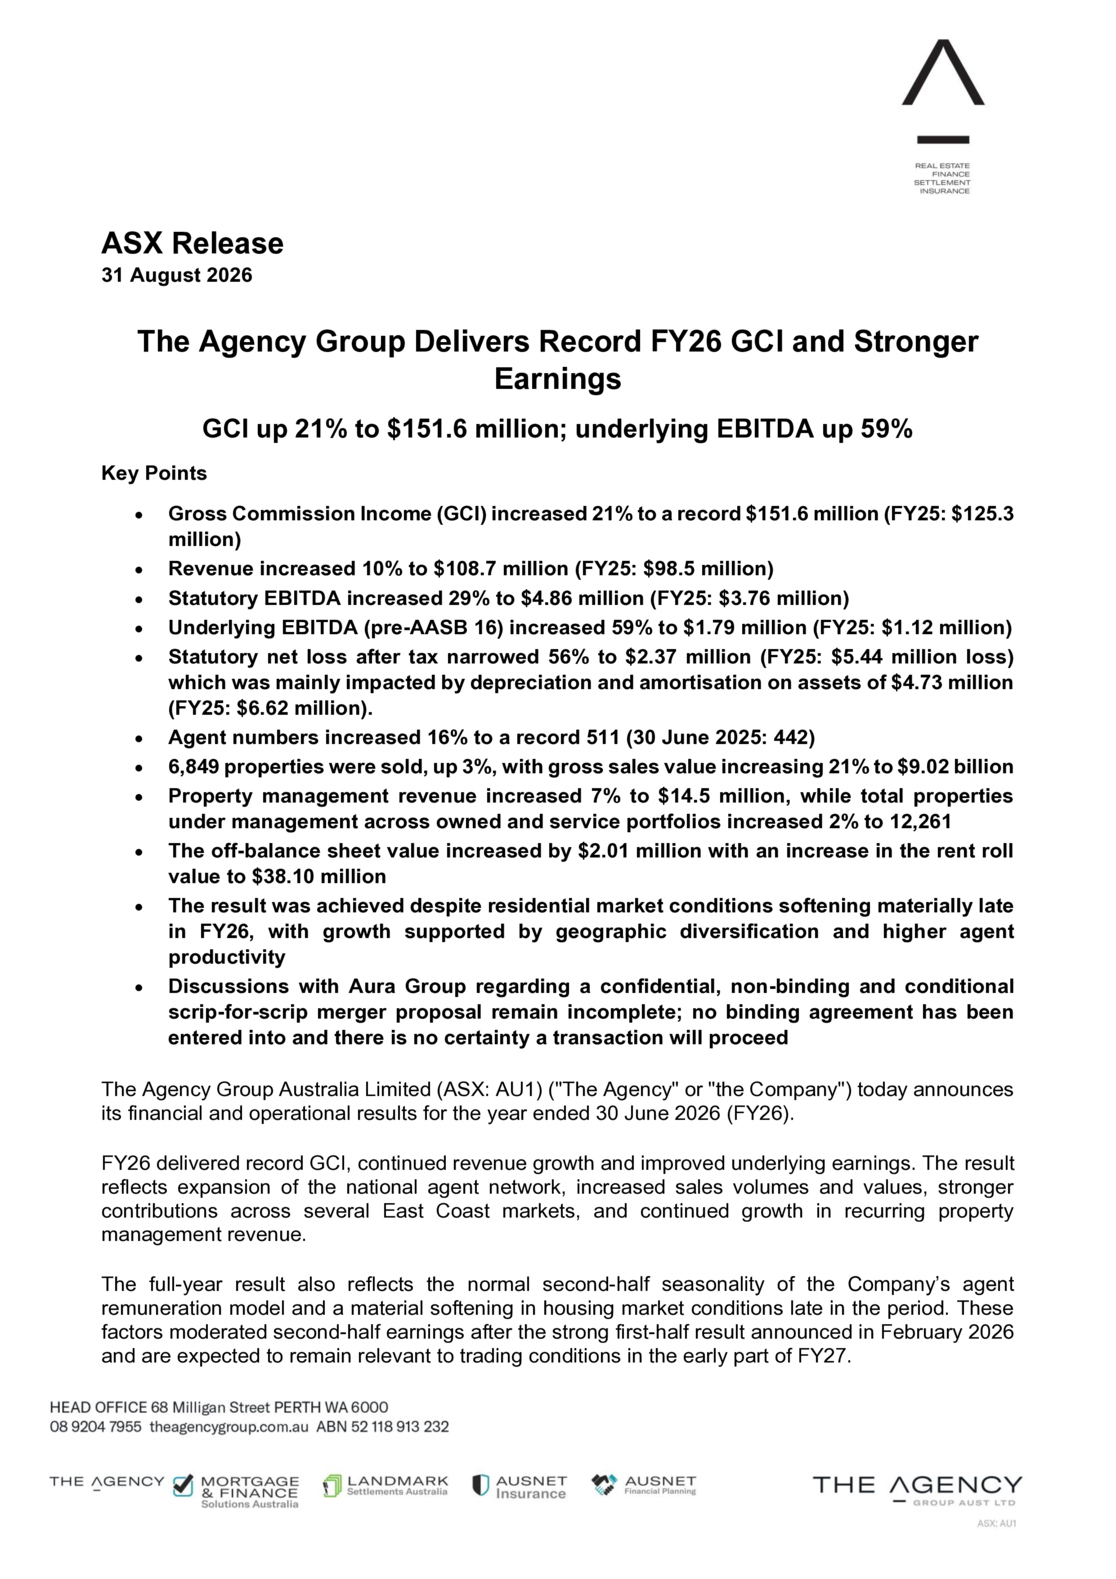
The Agency Group Delivers Record FY26 GCI and Stronger Earnings GCI up 21% to $151.6 million; underlying EBITDA up 59% Key Points • Gross Commission Income (GCI) increased 21% to a record $151.6 million (FY25: $125.3 million) • Revenue increased 10% to $108.7 million (FY25: $98.5 million) • Statutory EBITDA increased 29% to $4.86 million (FY25: $3.76 million) • Underlying EBITDA (pre-AASB 16) increased 59% to $1.79 million (FY25: $1.12 million) • Statutory net loss after tax narrowed 56% to $2.37 million (FY25: $5.44 million loss) which was mainly impacted by depreciation and amortisation on assets of $4.73 million (FY25: $6.62 million). • Agent numbers increased 16% to a record 511 (30 June 2025: 442) • 6,849 properties were sold, up 3%, with gross sales value increasing 21% to $9.02 billion • Property management revenue increased 7% to $14.5 million, while total properties under management across owned and service portfolios increased 2% to 12,261 • The off-balance sheet value increased by $2.01 million with an increase in the rent roll value to $38.10 million • The result was achieved despite residential market conditions softening materially late in FY26, with growth supported by geographic diversification and higher agent productivity • Discussions with Aura Group regarding a confidential, non-binding and conditional scrip-for-scrip merger proposal remain incomplete; no binding agreement has been entered into and there is no certainty a transaction will proceed
The Agency Group Australia Limited (ASX: AU1) (“The Agency” or “the Company”) today announces its financial and operational results for the year ended 30 June 2026 (FY26).
FY26 delivered record GCI, continued revenue growth and improved underlying earnings. The result reflects expansion of the national agent network, increased sales volumes and values, stronger contributions across several East Coast markets, and continued growth in recurring property management revenue.
The full-year result also reflects the normal second-half seasonality of the Company’s agent remuneration model and a material softening in housing market conditions late in the period. These factors moderated second-half earnings after the strong first-half result announced in February 2026 and are expected to remain relevant to trading conditions in the early part of FY27.
Executive Chairman Andrew Jensen said:
“FY26 was another year of meaningful progress for The Agency. We grew GCI by 21% to a record $151.6 million, expanded our agent network to more than 500 and delivered a further improvement in underlying earnings.
The result demonstrates the value of our national platform and the operating leverage available as productive agents and established offices join the network. Importantly, we achieved this growth while market conditions became more challenging late in the year.
Our priorities remain disciplined recruitment, improved productivity, growth in recurring property management income and careful cost management. While the current market requires a measured approach, the scale of our national platform positions the business to respond when transaction conditions improve.”
FY26 Financial Performance
Metric FY26 FY25 Change Gross Commission $151.6m $125.3m +21% Income Revenue $108.7m $98.5m +10% Gross profit $35.7m $32.1m +11% Gross margin 32.8% 32.5% +0.3ppt Statutory EBITDA $4.86m $3.76m +29% Underlying EBITDA (pre- $1.79m $1.12m +59% AASB 16) Statutory net loss after $(2.37)m $(5.44)m 56% improvement tax
Revenue growth of 10% was underpinned by a 21% increase in GCI and a 7% increase in property management revenue. Gross profit increased 11% and gross margin expanded modestly to 32.8%.
Operating expenses increased 10% to $34.5 million, broadly in line with revenue growth, as the Company invested in its larger national network and growth platform. Statutory EBITDA increased 29% to $4.86 million, while underlying EBITDA (pre-AASB 16) increased 59% to $1.79 million.
The statutory net loss after tax reduced 56% to $2.37 million from $5.44 million. The FY26 result included interest and finance costs of $1.94 million and depreciation and amortisation of $4.73 million. The improvement was assisted by the previously foreshadowed reduction in non-cash rent roll amortisation following the conclusion of the majority of NSW rent roll amortisation in September 2025.
Financial Position
Cash and cash equivalents were $4.24 million at 30 June 2026, compared with $5.07 million at 30 June 2025. Net assets were $0.08 million, compared with $2.45 million a year earlier, reflecting the statutory loss recorded for FY26.
The balance sheet does not recognise the full value of internally generated property management assets. The independently assessed market value of the Company’s owned rent rolls was
approximately $38.10 million, of which $2.68 million was recognised on the balance sheet. This represents an estimated $35.42 million (2025: $33.41 million) of value not reflected in reported net assets, an increase of $2.01 million in the current year.
Residential Sales – Record GCI and Broader National Scale
- Agent numbers increased to 511, up 69 from 30 June 2025.
- Listings increased 5% to 7,971, with total listing value increasing 9% to $10.84 billion.
- The number of properties sold increased 3% to 6,849.
- Gross sales value increased 21% to $9.02 billion, reflecting an 18% increase in average sale price to approximately $1.32 million and a larger contribution from higher-value markets.
- Revenue per agent increased 4% to approximately $62,400.
- GCI growth was led by Queensland, Tasmania, New South Wales and Victoria. Western Australia remained the largest contributor to GCI, although transaction volumes moderated during the year.
- The total listing pipeline has increased from 1,878 listings in July 2025 to 2,813 listings one year later. We estimate the GCI would approximate $75.0 million on the sale of these listings which is a 58% increase year on year.
The national housing market softened late in FY26 as affordability constraints, higher interest rates, cost-of-living pressure and uncertainty weighed on buyer demand. Against this backdrop, The Agency’s geographic diversification and expanded agent network supported continued growth in sales value and GCI.
Australian Residential Market Conditions
Cotality’s August 2026 Monthly Housing Chart Pack indicates that housing market momentum weakened further in July, with national sales volumes declining, selling periods lengthening, advertised stock increasing and dwelling values falling over the quarter.
- National home sales declined 0.8% over the year to July 2026 and monthly sales remained below the five-year average. Sales volumes across the combined capital cities fell 3.5%, while combined regional volumes increased 4.2%, continuing the divergence between markets.
- The national median time on market increased to 35 days in the three months to July, from 32 days in the previous month. The median selling period increased to 33 days across the combined capitals and 39 days across regional markets, compared with 26 days and 36 days respectively a year earlier.
- Total advertised listings were 14.9% higher than a year earlier over the four weeks ended 9 August 2026 and were 0.1% above the five-year average nationally. Total capital-city listings were 22.6% higher year on year, compared with growth of 4.5% across regional markets. Cotality attributed the increase principally to easing buyer demand rather than a surge in new listing activity.
- Vendor discounting continued to increase as buyers gained greater negotiating leverage. Across the combined capitals, the median discount widened to 3.9% in the three months to July from 3.2% in the three months to April, while the regional median widened to 3.7% from 3.3%.
- Combined capital-city auction clearance rates declined from approximately 66% in February to a low of 42.3% in late June. Although clearance rates subsequently improved modestly, they remained below 50% from the final week of May, indicating persistently subdued auction conditions.
- National dwelling values declined 1.9% over the three months to July 2026. Combined capital- city values declined 2.5% and combined regional values reduced 0.1%. Sydney and Melbourne recorded quarterly declines of 4.0% and 3.4% respectively, while Brisbane declined 0.6% and Perth declined 0.3%. Notwithstanding the quarterly decline, national dwelling values remained 5.3% higher over the year to July, supported by stronger growth in regional and lower-value markets.
The RBA held the cash rate at 4.35% in August for a second consecutive meeting following three increases between February and May. Cotality noted that mortgage rates continued to rise as those increases flowed through to borrowers, reducing borrowing capacity and maintaining pressure on household budgets and property demand1.
These indicators reinforce that the operating environment entering FY27 is more challenging than the conditions prevailing through much of FY26. Elevated stock levels, longer selling periods and weaker capital-city sales may continue to constrain transaction activity. The timing and pace of any recovery remains uncertain and is likely to depend on interest rates, inflation, affordability, household confidence and the balance between available stock and buyer demand.
1 Source: Cotality, Monthly Housing Chart Pack, August 2026. Listings data is for the four weeks ended 9 August 2026. Recent sales-volume data includes modelled estimates and may be subject to revision.
Property Management – Recurring Revenue Base Continues to Grow
Property management revenue increased 7% to $14.48 million. Management fee revenue from the Agency-owned portfolio increased to $10.54 million from $9.76 million. At 30 June 2026, The Agency owned 5,481 management rights and managed a further 6,780 properties under service arrangements, taking the combined portfolio to 12,261 properties, up 2% year on year.
The owned portfolio was broadly stable, while the service portfolio grew by 313 properties. The vacancy rate across the owned portfolio increased to 7.85% from 7.24%, reflecting softer conditions in parts of the portfolio. The division nevertheless continued to provide recurring revenue and earnings resilience across residential transaction cycles.
Business Model and Growth Strategy
The Agency continues to focus on attracting productive real estate agents to its contemporary direct- engagement model. By contracting directly with agents, the Company removes the traditional ‘middle layer’, creating a more responsive and efficient model while reducing the administrative burden on agents associated with operating an office.
Future growth is expected to be supported by attracting agents across existing markets, selective expansion into new regions, and improved efficiencies from economies of scale and best-practice technology that enables agents to maximise productivity.
The highly fragmented structure of the Australian real estate industry also presents potential consolidation opportunities among smaller independent and franchise operations seeking to simplify their businesses. The Company will assess these opportunities selectively and with regard to their potential contribution to earnings, agent quality and long-term platform value.
The Agency also continues to assess strategic partnerships and adjacent revenue opportunities related to residential sales, in addition to its established property management, mortgage broking and conveyancing businesses. Any investment or transaction will remain subject to disciplined assessment, available funding and the Company’s continuous disclosure obligations.
Settlements
The settlements business completed 1,732 transactions during FY26, compared with 1,757 in FY25. Settlements revenue reduced 6% to $2.12 million, with average revenue per transaction declining to approximately $1,124 from $1,187.
Second-Half Trading
The Company delivered underlying EBITDA of $2.06 million in the first half. The full-year outcome reflects an underlying EBITDA loss of approximately $0.27 million in the second half, driven by normal seasonality in agent commission structures as annual performance thresholds were reached, investment to support the larger network, and a cooling in national housing activity late in FY26.
The Agency’s national footprint provided some protection from divergent state-level conditions, with stronger contributions from several East Coast markets offsetting softer volumes in Western Australia.
However, continued weakness in transaction volumes or a further deterioration in buyer demand could affect GCI, revenue and earnings in FY27.
Strategic Discussions with Aura Group
As announced on 7 August 2026, The Agency has held discussions with Aura Group Holdings Pte Ltd (Aura Group) and other parties in relation to establishing and managing the Company’s rent roll fund and financing opportunities for rent roll acquisitions.
Those discussions with Aura Group evolved to a potential transaction under which Aura Group made a confidential, non-binding and conditional proposal regarding a scrip-for-scrip merger, based on a current indicative transaction price of $0.04 per AU1 share and a valuation of Aura Group that remains under discussion, subject to Aura Group’s listing on ASX.
The Board has provided Aura Group with a period of exclusivity to conduct due diligence and progress relevant transaction documentation. The proposal remains subject to negotiation and execution of definitive documentation, satisfactory mutual due diligence, regulatory approvals and other customary conditions.
No binding transaction agreement has been entered into and there is no certainty that the discussions will result in a transaction. AU1 shareholders do not need to take any action. The Company will provide further updates in accordance with its continuous disclosure obligations.
Outlook
The Agency enters FY27 with a larger agent network, record FY26 GCI and an expanded recurring property management platform. These provide a stronger operating base; however, the near-term outlook is tempered by weaker housing market momentum and uncertainty around the duration of current conditions.
At July 2026, the Group’s national listing pipeline represented approximately $75.0 million of indicative potential GCI, based on current listing values and historical average commission rates, compared with approximately $47.3 million at July 2025. Applying a 7.5% prudence adjustment for potentially stale or non-converting listings results in an adjusted indicative value of approximately $69.4 million. These figures represent a point-in-time measure of potential GCI and are not contracted revenue or earnings guidance. Actual conversion remains subject to listing withdrawals, timing, vendor price changes, commission arrangements and prevailing market conditions.
Cotality’s August data points to declining national sales volumes, materially higher advertised stock, longer selling periods, increased vendor discounting, weaker auction clearance rates and a broader quarterly decline in dwelling values. Higher borrowing costs and affordability constraints may continue to weigh on transaction volumes, particularly across the major capital-city markets. Accordingly, the Company is not assuming a near-term return to the market conditions experienced earlier in FY26.
Management will maintain a disciplined approach to costs, recruitment and investment. Priorities for FY27 include retaining and improving the productivity of the existing agent network, selectively recruiting high-performing agents and established offices, protecting margins, growing recurring property management revenue and developing the Service Plus offering.
The Company has surpassed its previously stated GCI run-rate milestone of approximately $150 million. The Board retains its longer-term ambition to grow GCI to $175 million and ultimately $200 million. The timing of progress towards these objectives is uncertain and will depend on market conditions, agent productivity, recruitment outcomes and execution. The Company is not providing FY27 earnings or GCI guidance at this time.
If you require further information, please contact:
Investors
Andrew Jensen
The Agency Group Australia Ltd
Media
Chapter One Advisors
David Tasker
+61 433 112 936
Colin Jacoby
+61 439 980 359